
Spiral Chart for PowerPoint and Google Slides
(15 Editable Slides)


Spiral Chart for PowerPoint and Google Slides

SB103
Available For


Tags:
Similar Products
- Sale

- Sale
- Sale

Who doesn't want to present effectively and place every point in easily understandable way? Of course it works incredibly well if you are to explain a movement from the initial to the final stage of concept or a situation. But then, creating them in your slides isn't an easy job at all. It may take hours to do it the right way, if you are to start from the scratch. This is why pre-designed template with complete customization option is preferred.
You don't have to spend hours in creating complicated diagrams and designs. All you have to do is download the template, edit the slides and include them in your visuals. Now, if you are ready with awesome content and powerful way to present yourself, you are done just in a few minutes.
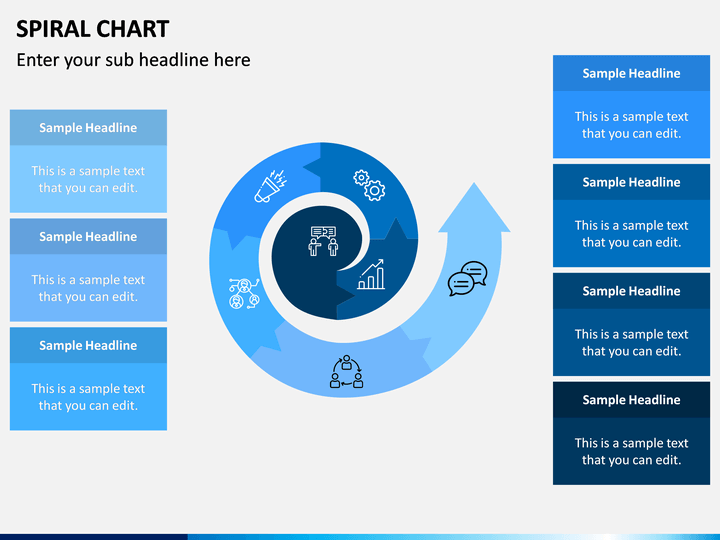
Whether you are explaining the process involved in the systems development life cycle or you aim at describing various factors impacting the project you are to start. From processes like supply chain to market expansion for certain products or services or some kind of gradual growth, visualizing your point will be a breeze.
When the quality is perfect and you have entire control on the basic elements that make up your slides, do you still have to worry about anything? No, you don't. You can tweak the graphics according to your need. You can add the content exactly at the place you want. And you can do all this and lot more without making a lot of efforts.
About
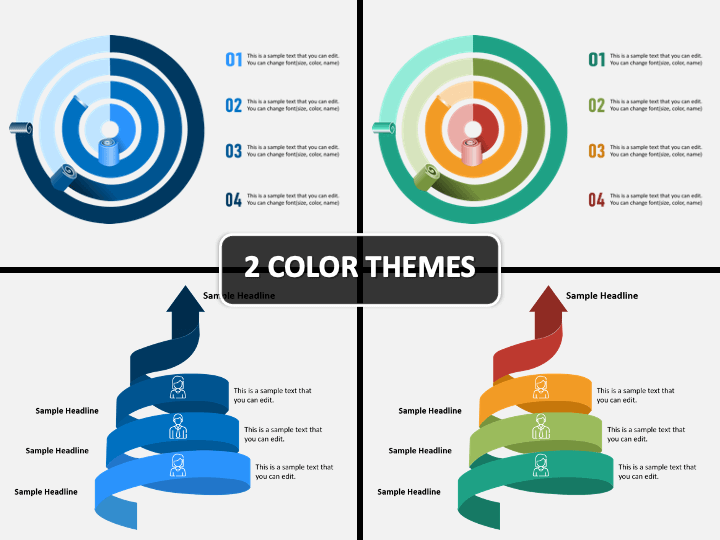
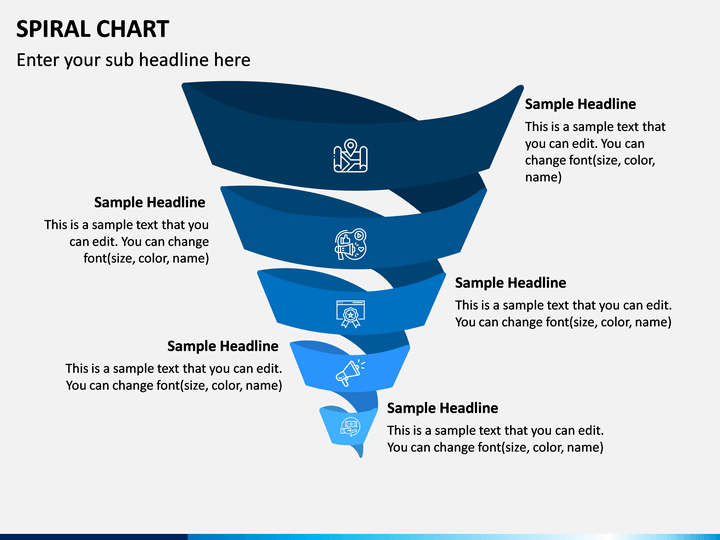
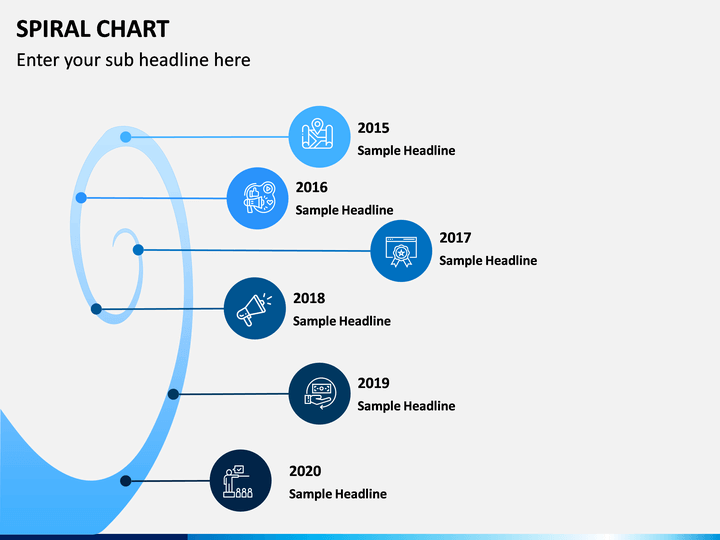
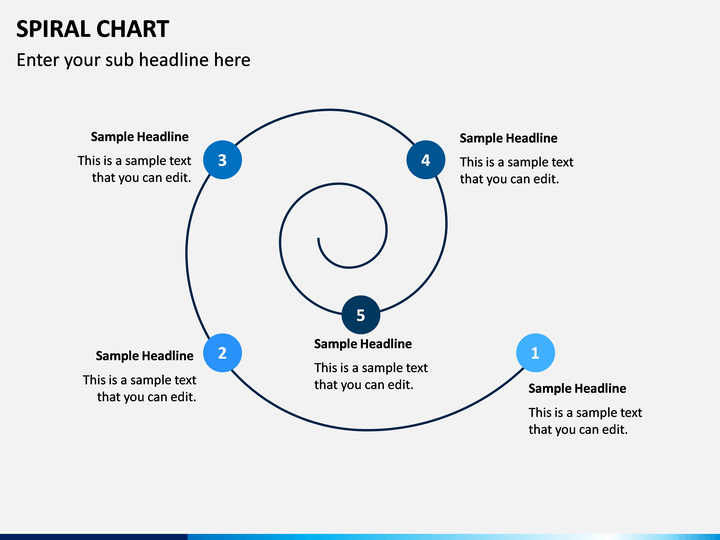
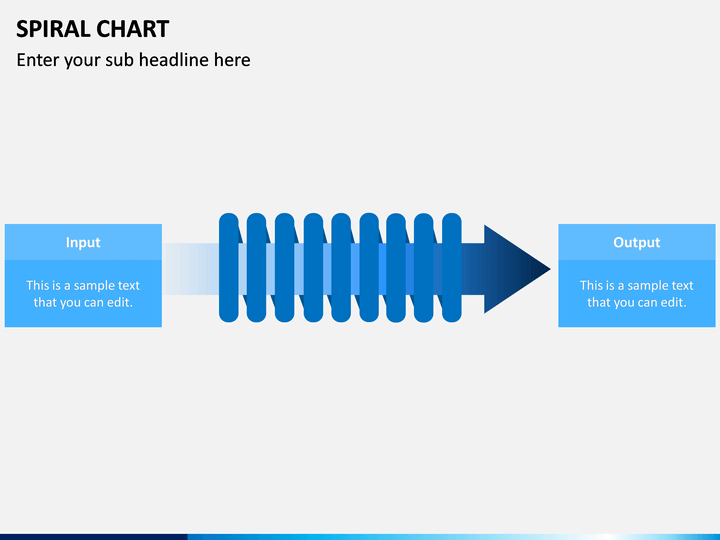
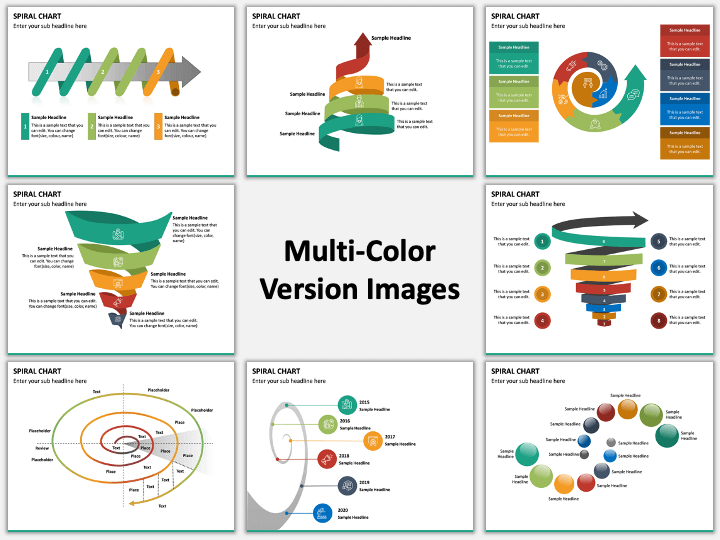
Spiral chart diagrams are best way to illustrate complex concepts, processes, process cycles & flows, and strategy planning. Whether you want to show various iterations or explain continuous loops in a process, this works just the best. This is because the spiral arrow makes it easier to demonstrate any kind of gradual change that may be in terms of improvement or damage. Further, the curls can also be used in representing time in terms of days, weeks or months of a year.
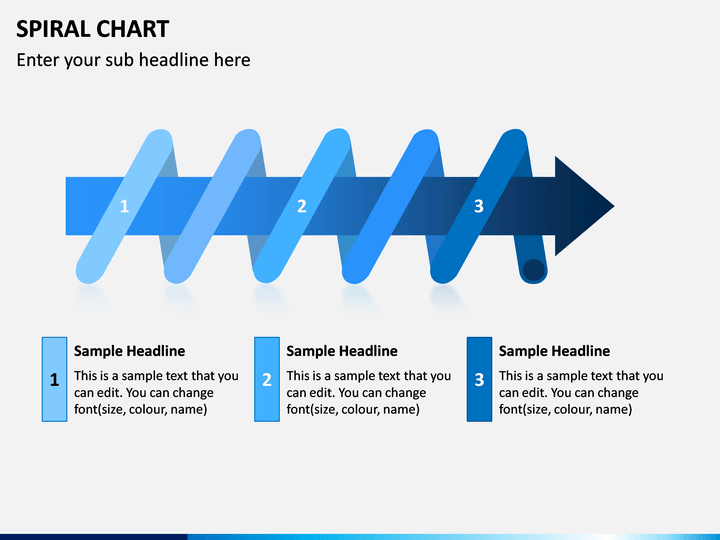
Thus from project development and the entire life cycle of the development to risk management, these diagrams prove really beneficial in explaining your point. Thus, they occupy important place in business presentations regardless of what verticals they are pertaining to. You may be dealing with the production and manufacturing or sales and marketing or finance and budgeting. In every case, it works incredibly well, especially because of its unique design and shape.
Write Your Own Review

Related Products


