
Curve and Trends Chart for PowerPoint and Google Slides
(10 Editable Slides)


Curve and Trends Chart for PowerPoint and Google Slides

SB893
Available For


Similar Products
- Sale

- Sale
- Sale
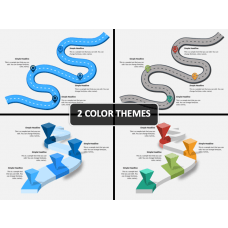

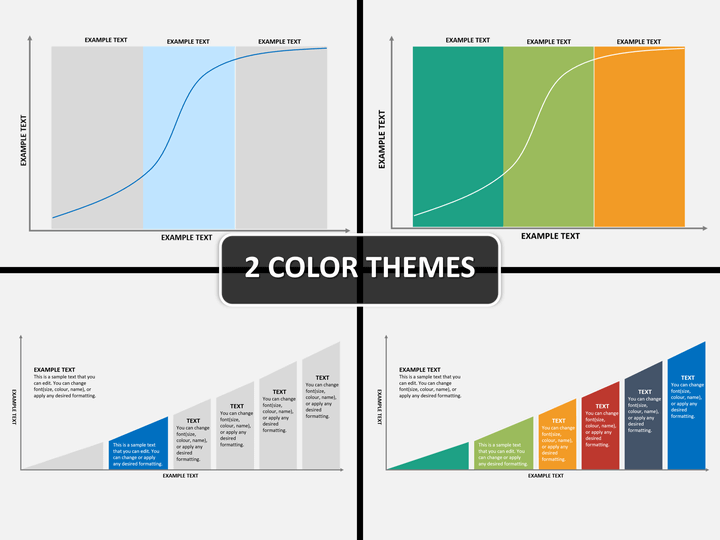
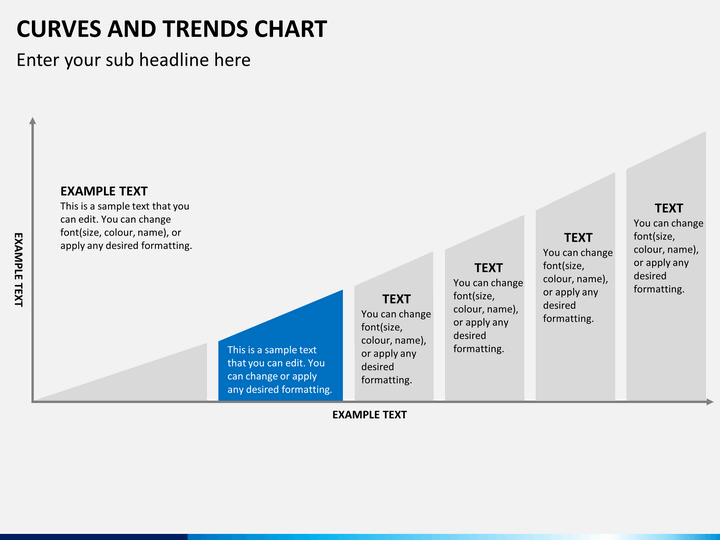
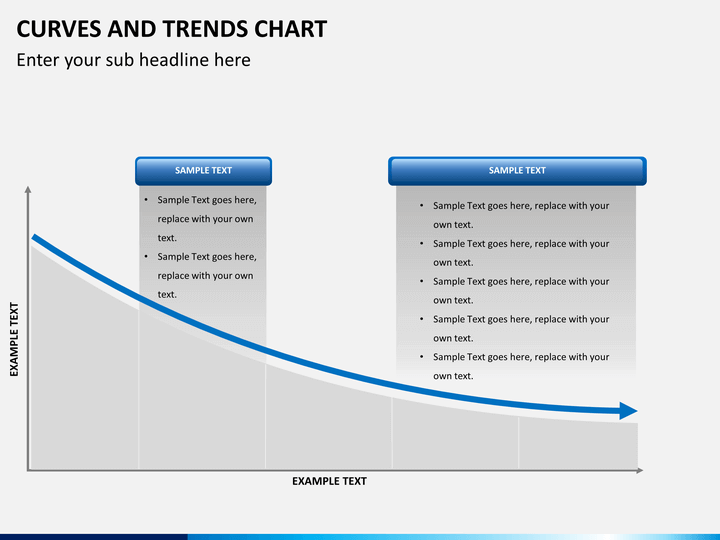
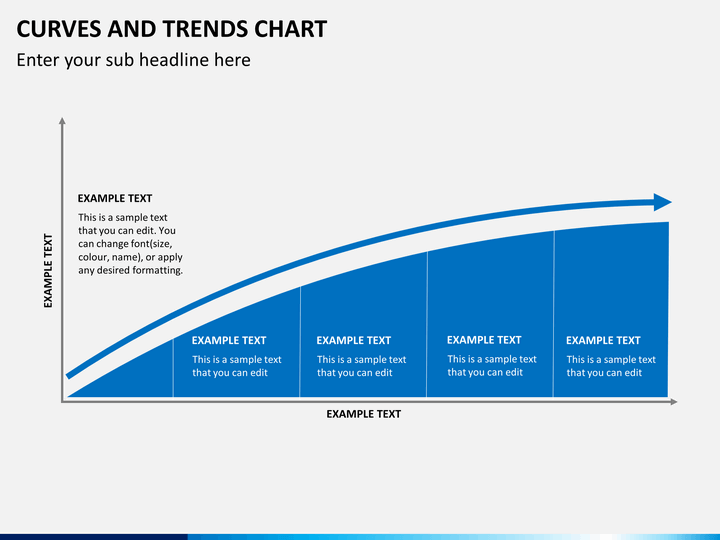
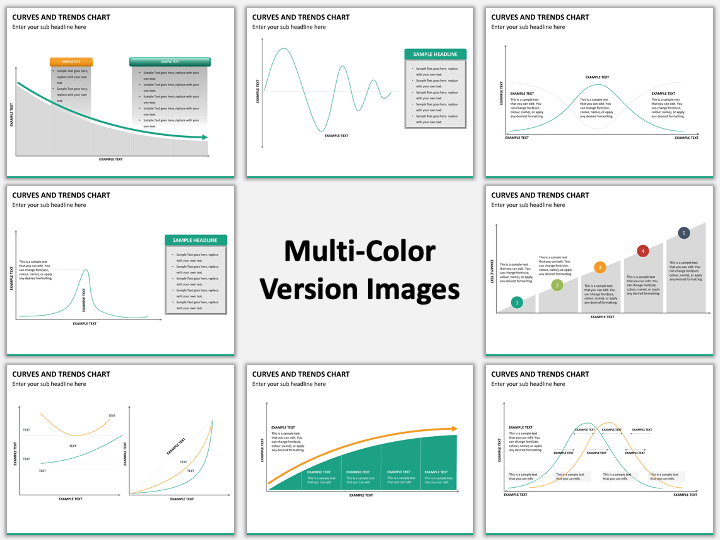
We provide you with 10 most adaptable and completely flexible PPT slides in its Curve and Trends Chart PowerPoint Template. Professionally crafted and aesthetically made, the set follows a thoroughly contemporary layout. Being fully editable, one gets complete freedom to play around the designing elements and mould the slides as per the needs. Top notch quality and versatility add more to the usability of the set. Each of the slides on the set offers a completely different pattern of curves and trends chart. This helps you display your information more creatively and add more variety to your ideas.
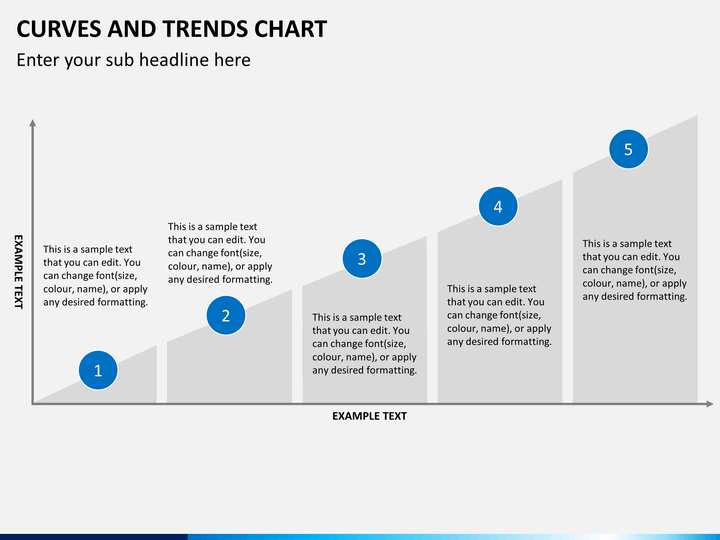
From showing financial growth and overall business progress to explaining interest rates or profit and loss rates, and ups and downs that a business comes across, the set is perfect for various different presentations. Whatever may your subject area be, the set is apt for presenting your ideas. From economical changes to chemical processes, wherever you feel the need of showing changes by plotting lines and curves, the set will assist you at best. Whether you are a market researcher or a business analyst, or a university student, you can always depend on these curves and lines for explaining your points. Best fit for presentation on the recession, major financial trends, production reports, as well as technical analysis and scientific research. Wherever you feel that including curves or lines or similar charts will better explain your point, this set will do the justice! From simple growth to normal yield, showcase whatever you want with the help of the set.
About
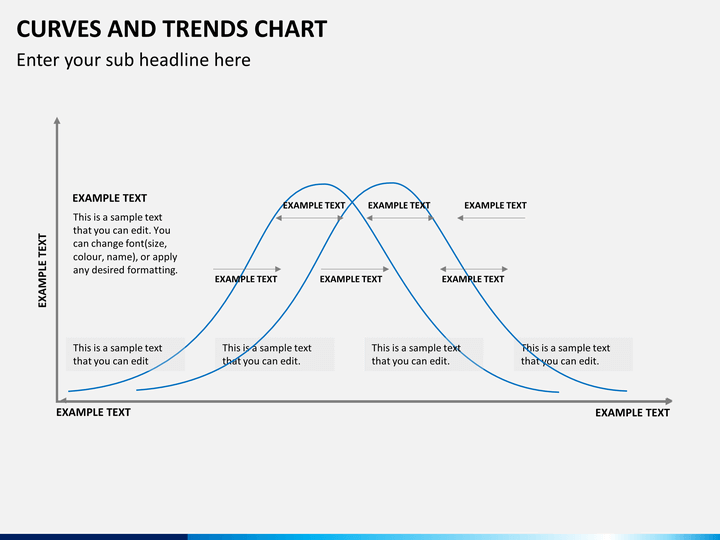
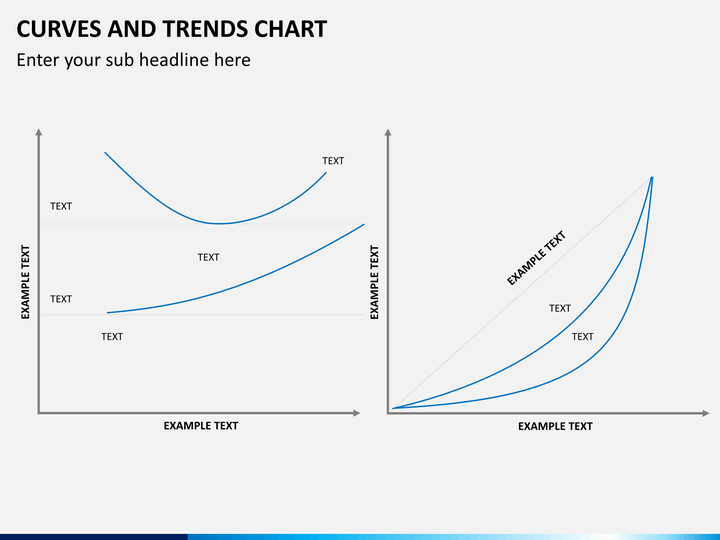
Curves, are, mathematically speaking, objects similar to lines but they are not straight. In other words, these are continuously bending lines without any angles. However, in some special cases these lines may form angles. Trend Charts are graphical representations that display your data or information on one side and time on the other. In other words, these are special charts for plotting information over time in proper sequence. Such charts are used for explaining any general pattern of change through curves also known as trend lines.
Write Your Own Review

Related Products


