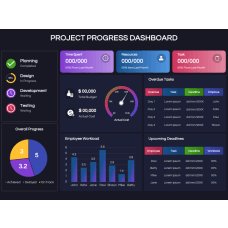
Dashboard
Dashboard PowerPoint Templates
Make data representation insightful with our stupendous data driven Dashboard PowerPoint templates. Using them, you can beautifully illustrate the metrics and key performance indicators (KPIs) to track the health and performance of an individual employee, team, department, specific project, or process. These pre-designed decks are the best pick to depict your analytical and operational data and the progress of the business against the set goals and benchmarks in a visually engaging manner.
The illustrations are 100% editable. You can easily resize and recolor the visual elements in line with your presentation’s tone and theme. You don’t need to have in-depth expertise in designing or editing to make modifications. So, download them with immediate effect!
Importance of Dashboard in Business Presentations
People have different frames of mind when they read a performance report through a document and view the same report through a slideshow. They are detail-oriented while reading and decision-oriented while attending the presentation. Many presenters fail to identify this difference and commit the mistake to treat the presentation and document the same, thereby losing their audience.
As a matter of fact, the audience is least interested in numbers and more focused on the inferences made from those numerical data. Thus, the way you present the data in your slideshows matters a lot. By using dashboards in your presentations, you can convert data into actionable insights, thereby making it easy for the audience to get a quick perspective of the performance of your business. So, download our Dashboard PPTs to represent complex data into easily digestible snippets and provide at-a-glance visibility into business performance across all projects, departments, and units to the intended audience!
Ideal for All Professionals
Professionals from all walks of life, be it business, education, research, finance, etc., will find these simple yet elegant decks quite useful. Business analysts, sales and marketing managers, senior executives, and others can use them for multiple purposes.
CEOs and Executives
For showcasing:
- annual productivity, sales, and profit
- income and expenses
- quarterly performance review of different business units, etc.
Marketing Managers and Digital Marketing Executives
For representing:
- new market trends
- return on marketing investments
- effectiveness of email and social media campaigns
- user engagement metrics across LinkedIn, Facebook, Twitter, Pinterest, and Instagram
- top converting keywords and top-performing pages of the website
- organic and paid traffic, etc.
Sales Heads
For illustrating:
- changes in sales figures and ROI over a period of time
- the average conversion time, customer lifetime value, monthly sales growth
- the average cost per lead, retention and churn rates
- sales by countries and territories, etc.
HR Managers
For depicting data related to:
- staff recruitment and employee retention
- cost per recruitment
- change in employee turnover before and after a new policy or technology is implemented in the organization
- the percentage of employees in the company by location, gender, department, age group, etc.
Impressive Features
- All the slides are compatible with Microsoft PowerPoint.
- You will not encounter copyright infringement issues.
- The vector-based and high-definition graphics ensure impeccable resolution on screens of all sizes.
- Get the ownership of the PPTs for the entire life by downloading them once.


