Gantt Charts Presentation for PowerPoint and Google Slides
(9 Editable Slides)
Gantt Charts Presentation for PowerPoint and Google Slides
Available For
Plan out your projects
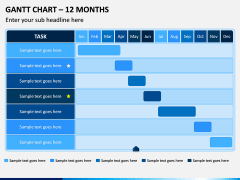
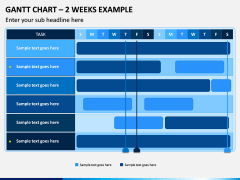
There are several methods that businesses and organizations employ to map out projects and initiatives. One of the most descriptive and useful ones is the Gantt Chart. These are bar graph charts that let you map out a project’s schedule. They also enable you to demonstrate dependent relationships between tasks in the chart and the current status of the schedule. One of the greatest obstacles to implementing and using these Charts regularly is the time it takes to create and format such a chart. But we have a solution for this! If you think that your presentations or materials could benefit from having a Gantt Chart in them, then look no further. Our Gantt Chart PowerPoint template is just what you need.
Be as detailed as you need to be
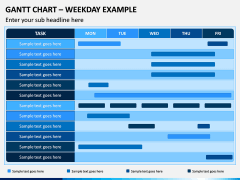
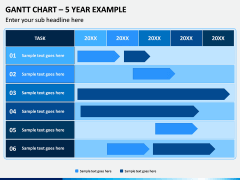
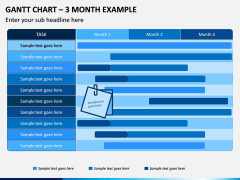
Our pre-prepared Gantt Chart PPT offers you a selection of Charts that can easily be adapted to suit your needs and goals. The chart templates we offer enable you to break down tasks and projects in yearly, monthly, bi-monthly, and daily increments. All of these charts have been formatted so that they are in an HD vector form. This means that you can easily plug in your data and edit them.
Customize with confidence
Creating and designing Gantt Charts is increasingly becoming a commonplace task for individuals, regardless of whether they are working professionals or students. Despite this, not everyone is comfortable with the Chart creation process. This is often because although these people are experts in their particular fields, they lack strong design and formatting skills. This is where we come in. Our presentation templates and visual assets are put together by professionals who have significant prior experience in design and material creation. They do all the heavy lifting when it comes to design and formatting so you can easily create a final product you are proud of. Just add, remove, and edit content with a few simple clicks. And you can do this even if you do not have any experience with the design!
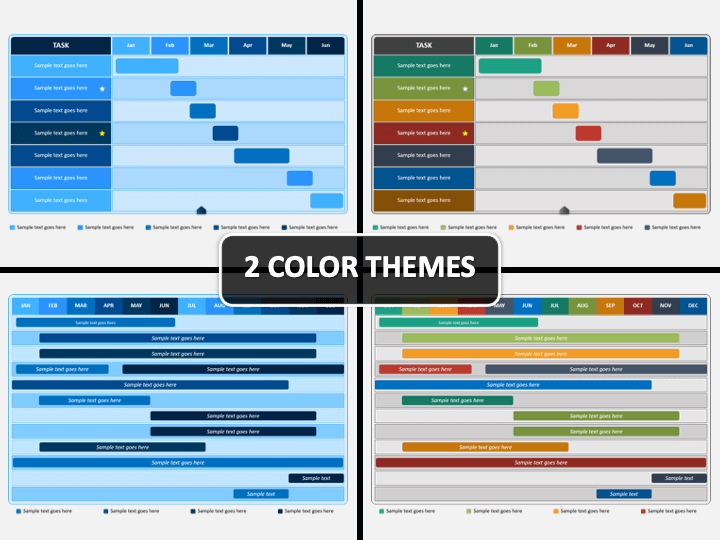
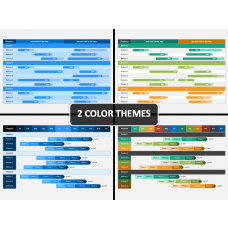
And to make things even better, this template comes in two different color themes. It can also be used across a range of programs, including Microsoft PowerPoint, Apple Keynote, and Google Slides.
Why you need Gantt Charts?
In several many conditions such as while scheduling and monitoring the tasks within a certain undertaking; while explaining the plans and the status of the activities. You can also use Gantt Charts while communicating the process steps or the time duration involved in it; how the completion of previous tasks will affect the next list of tasks; and so on.

