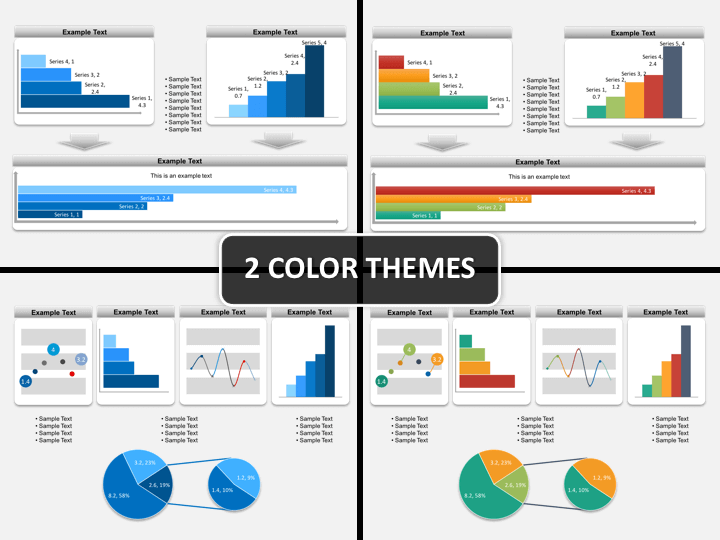
From important statistical information to complex business data, communicate in easy and effective manner.Use our professionally created pre-designed PowerPoint Interaction Graphs Template in your visuals and give a special meaning to your presentation. Get freedom from creating the slides from the scratch. Save your time and energy as you no more have to spend extra hours working on the visual aids. Get a creative advantage as the set is specially created by a team of field experts after a thorough research.
Whether you are to illustrate business competition or brief on market evaluation, the template will work well for your purpose. Howsoever large the quantities of your data may be; you will always have the ease of displaying them through visualization. From equipping your audience with research results to acquainting your stakeholders know about essential business information, you get maximum flexibility in using the slides. Being vector based, you get complete customization option. It is a breeze to modify the designing elements and give a newer look to the overall layout as per your needs. All the traditional elements, shapes, and symbols have more interactive quality. This makes your communication more authoritative and conveying your message has more outstanding results.
There is simply no need to hire any external designer nor is there a need to take any stress of getting ready with the slides. Whatever field of interest you have; whatever industry you deal with, you are done with your visuals within no time at all. This way you don't just save your time & efforts but also your money as the set is most reasonably priced. Adding content is easier too! And you can add it just the way you want. Even changing the position of your text placeholder is possible. Now, when you know how to mesmerize your audience through best-in-class illustrations go ahead and face them with all your confidence!!
About
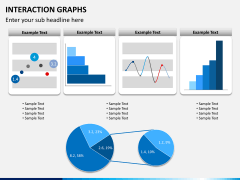
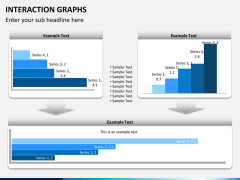
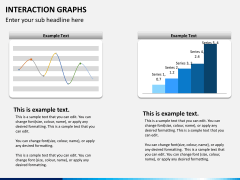
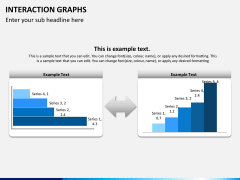
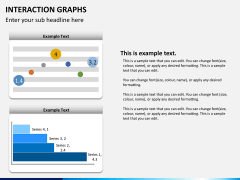
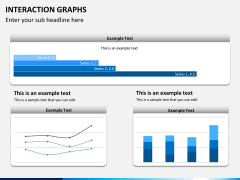
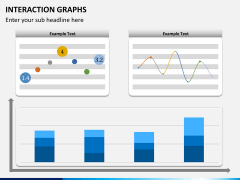
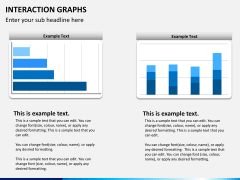
Interaction Graph can be defined as a data driven diagram used for data visualization with a possibility for emphasizing the various segments between the different parts of the diagram. At the same time it also works like histograms. One important thing about it is that you find all the traditional elements such as lines, bars, bubbles, pies and so on in more interactive manner in it. Using this, when you visualize the real proportions within the different parts of the diagram in your presentations, it works in simplest possible manner. Furthermore, it is worthwhile to use it when you have large quantities of various different data.

