


Similar Products
- Sale

- Sale
- Sale


Sometimes, you are so over-burdened with tasks at hand that creating visuals for an important presentation appears a tough job. At such times, fully editable pre-made slides make your task easier. And our professionally built pre-made PowerPoint Line Graph Template does just that. You can use the charts in various ways. From explaining the manufacturing process of a certain product to making observations in marketing trends, you can always depend on them. Built by a team of field experts, a better care of creativity and innovation has been taken. You get complete customization option along with the freedom from formatting as it comes pre-formatted.
The slides are immensely flexible. Thus, you can incorporate them into any PowerPoint suite without worrying about compatibility and other technicalities. Apart from this, you also get maximum versatility on the set. So, whether you are to present an economical review or show how financial trends in your sector are changing, you can mold these slides as per your needs. Similarly, if you are a scientist to present your observations in some conference or a student submitting PhD thesis, the set will prove beneficial for you. From business meetings to annual reports; financial analysis to manufacturing timelines; marketing and sales trends to financial and economical reviews, this versatile set will always be useful for you.
It is super easy and absolutely time saving to use this template. You no more have to create your visuals from scratch. Nor there is any need of making whole lot of efforts. With simple editing and touch up your task will be all done. As you save a lot of time, you can focus on the content part and be sure of delivering at your best. From now on, you will always be ready for you presentation in a matter of few minutes. So, go ahead communicate well and reach your audience most effectively.
About
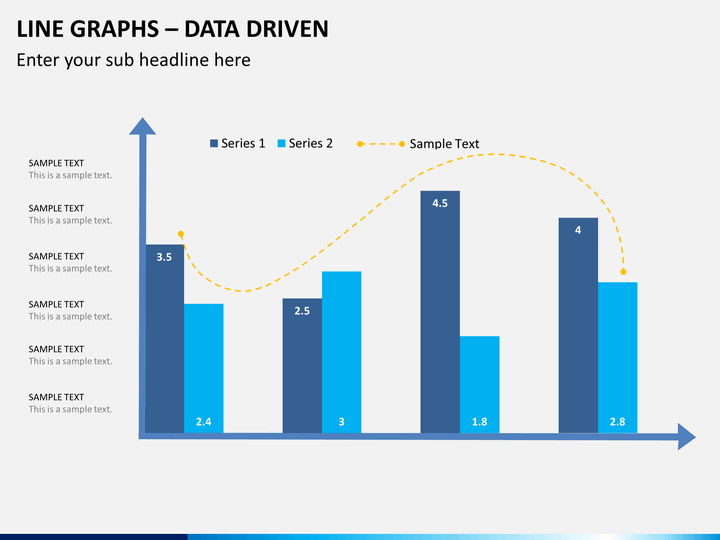
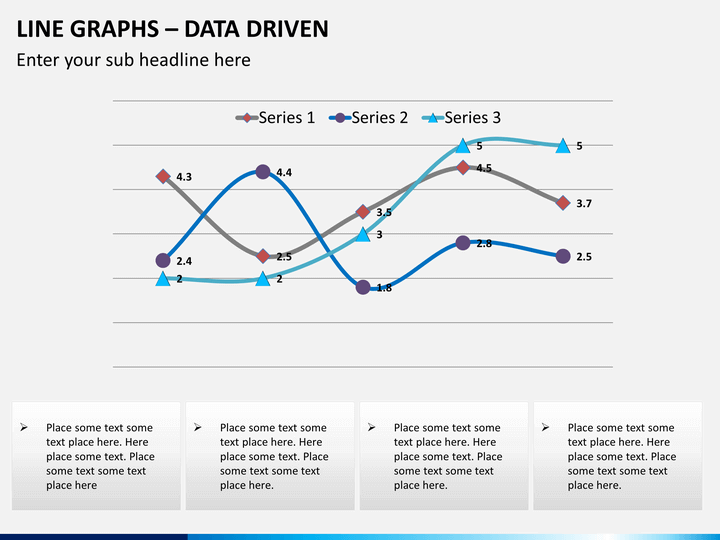
A Line Graph or Line Chart can be defined as a two-dimensional scatter-plot containing ordered observations connected following the order in which they present. It can be defined as such because of its similarity with a scatter plot with an exception that in this case data points are in ordered form. The observations or the information is displayed through a series of data points often called as markers which are then connected by straight line. Since it is quite basic in type and is known for its versatility, it is quite commonly used in various fields. It is a great way to represent collected data that changes at certain point in time. It is widely used in scientific experimentation and for other processes where the changes in the observations are to be marked or where the data trend has to be observed over an interval of time.
Write Your Own Review

Related Products


