


Similar Products
- Sale

- Sale
- Sale


Of course, Pie Charts work most effectively in displaying your data and making your point clearer. But when you look forward to giving your cent per cent, crafting the slides is no easy a game to play. The good news is that with pre-designed 100% customizable template, your labor is saved and there is absolutely no compromise with the quality. Moreover, you no more have to follow boring, routine, age-old visuals. You have more graphic options, with newer and more interesting shapes and designs.
Not just illustrating your point gets easier but it also gets superior, innovative and more attention grabbing. From showing budget allocation for a certain fiscal to comparing the profit percentage of the different products that you sell, you will get to display data, facts and numerical proportions in a much smarter way.
With easy editing option and truly versatile features you get to create most terrific visuals. Regardless of the theme and subject area, you excel in illustrating your points. From educative to business oriented; social to political, every area that you select to speak on - happens outstandingly! You can change the colors, fonts, characters and other designing elements in just a few minutes. You get to handle the layouts the way you want. It is equally easy to add your text and you get to do it in a most appealing way. You are ready for the presentation in most terrific way without having to spend hours on it.
About
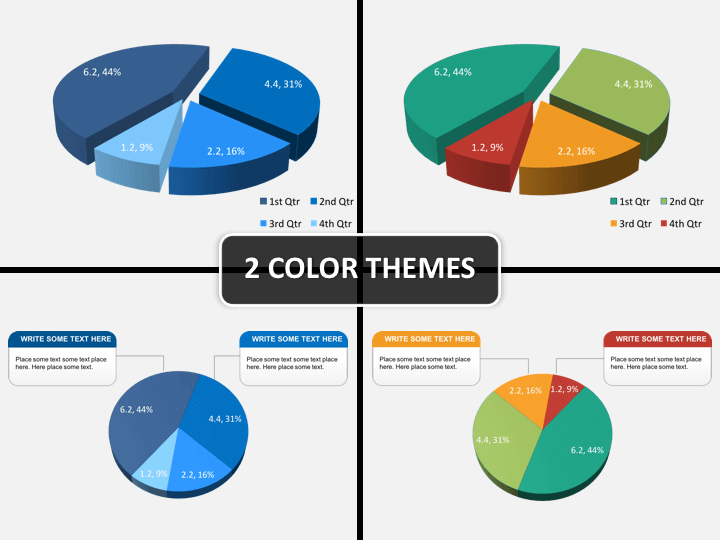
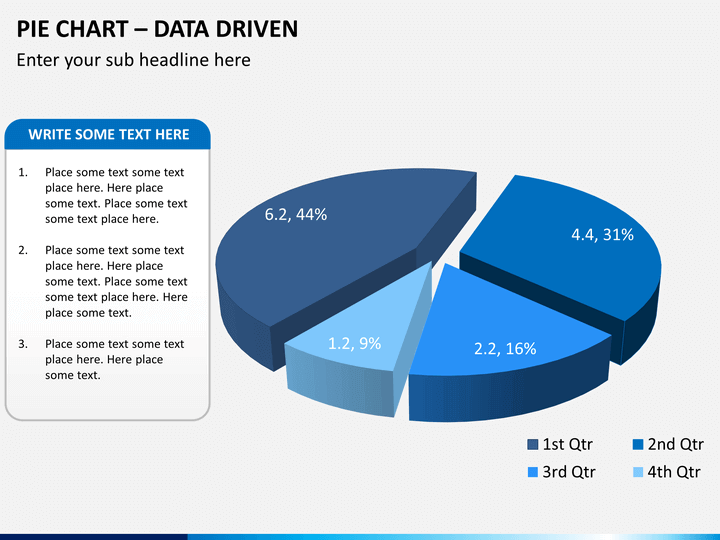
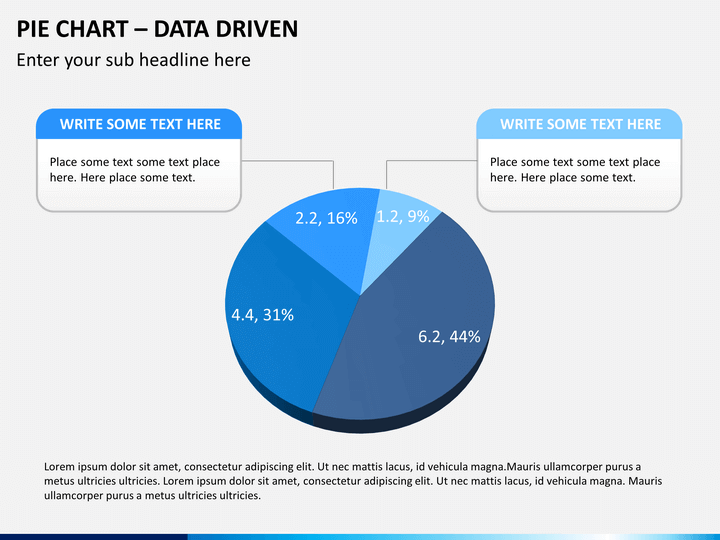
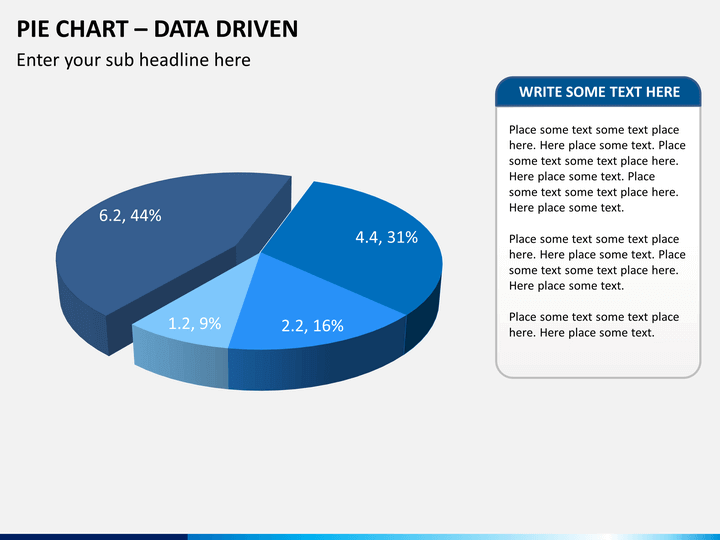
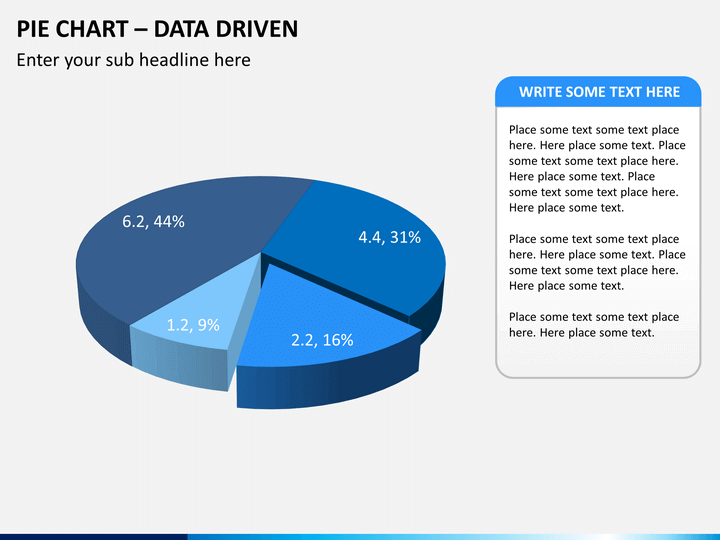
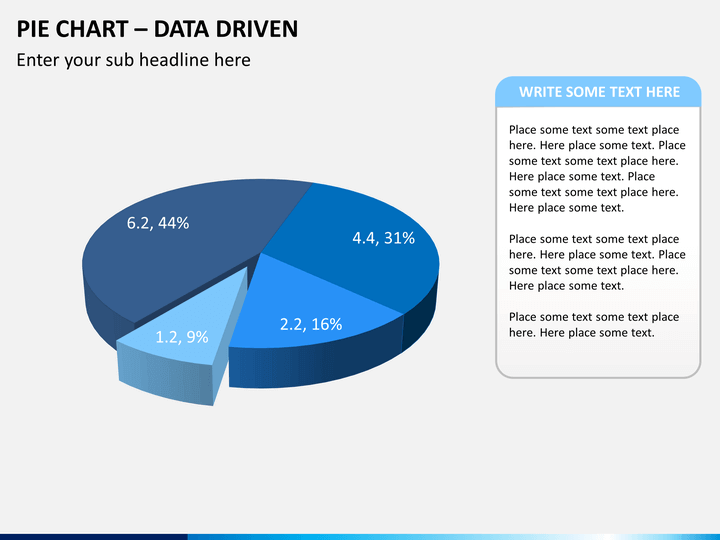
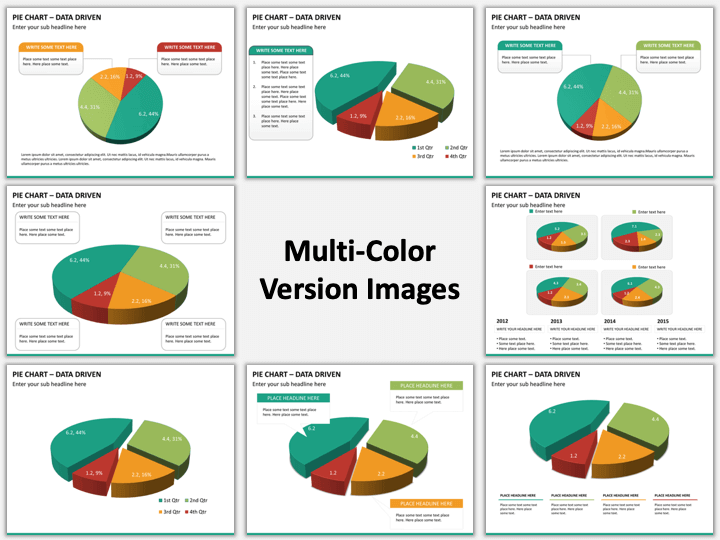
Pie charts are one of the most popular chart types. Circular in form, these include several divisions illustrating various factors or aspects in numerical proportions. Or in other words, you can consider a large sized pie with several slices cut off from it. Each slice pertains to a particular group, event, or factor. For instance, your company sells three different products and you are to show the profit percent of each of these products. The circular whole will be all three products and three slices out of it will display each of them.
From all kinds of analysis, media & newsroom discussions to business reports, these play important role in various different fields. Even in regular business meetings and related presentations, they have a vital place.
Write Your Own Review

Related Products


