


Similar Products
- Sale

- Sale
- Sale


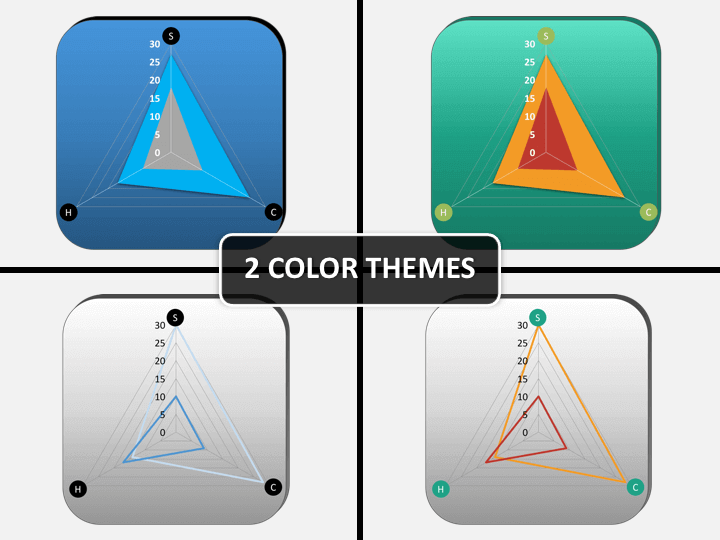
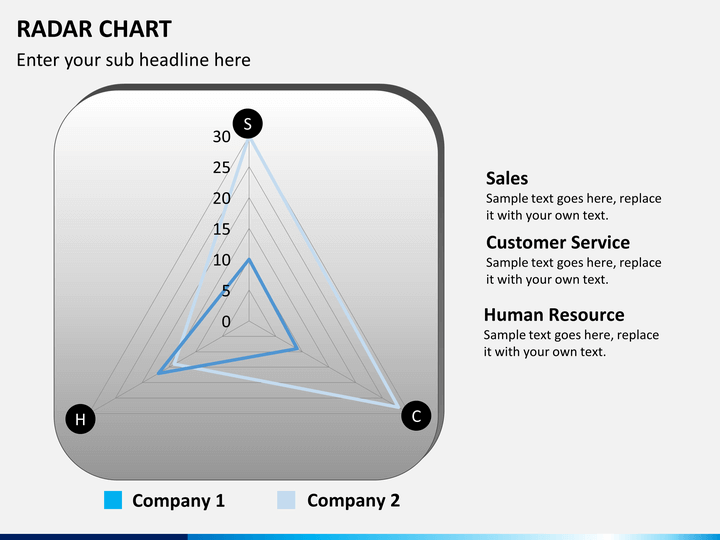
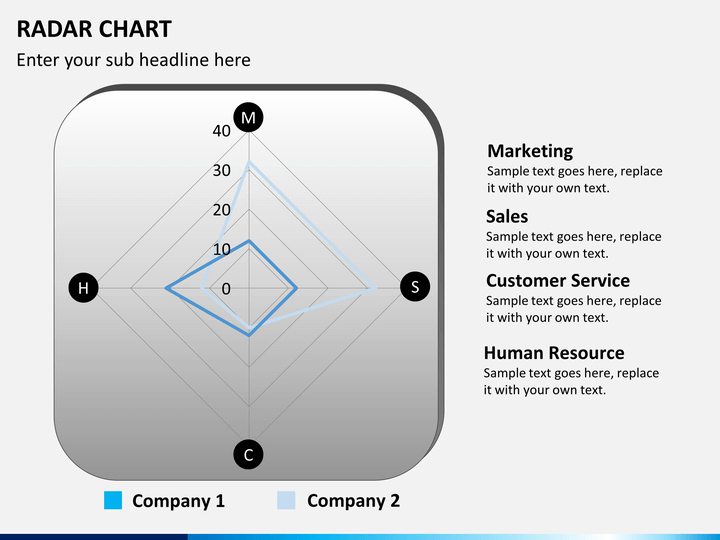
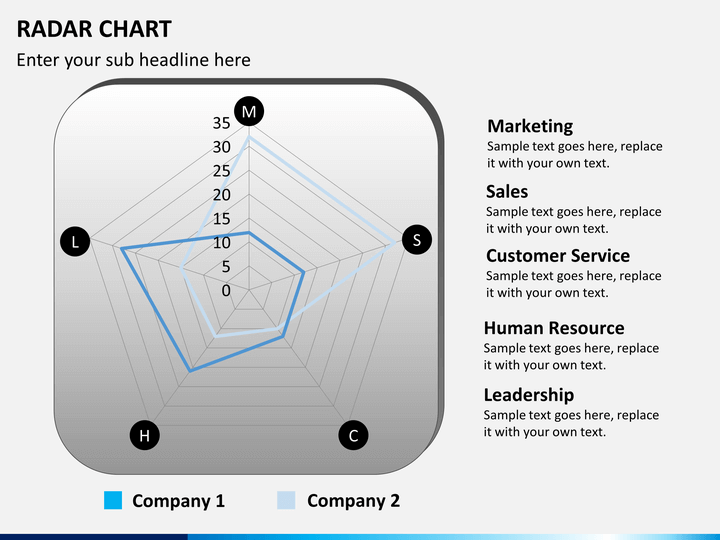
Our Radar Chart PowerPoint template features Charts which are a method of displaying multivariate data. This template set consists of 8 editable PPT slides each of which contains a Chart displayed along with some demo data and text on the right.
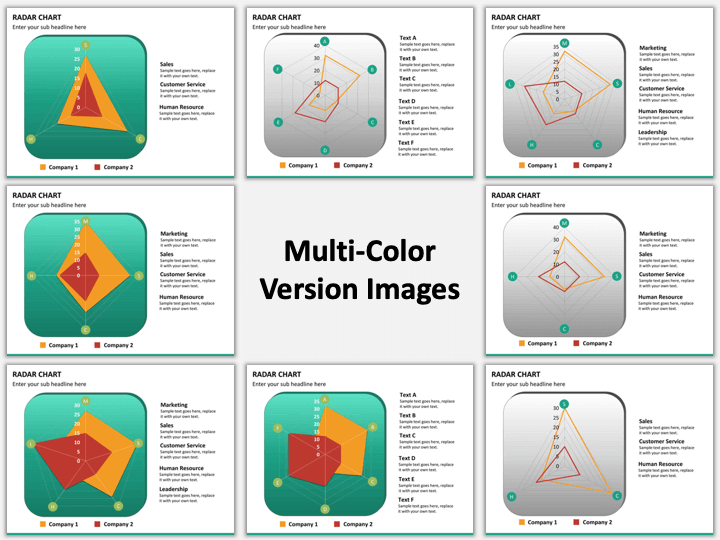
Radar Charts are complex diagrams to make and are used for complex representations of data. Our professionals have designed this template keeping in mind the problems you could face while editing this presentation, so each slide has a different Chart so that you don't have to create one. All these Charts are of different Orientations so that you can copy and paste them in other slides if you require to do so.
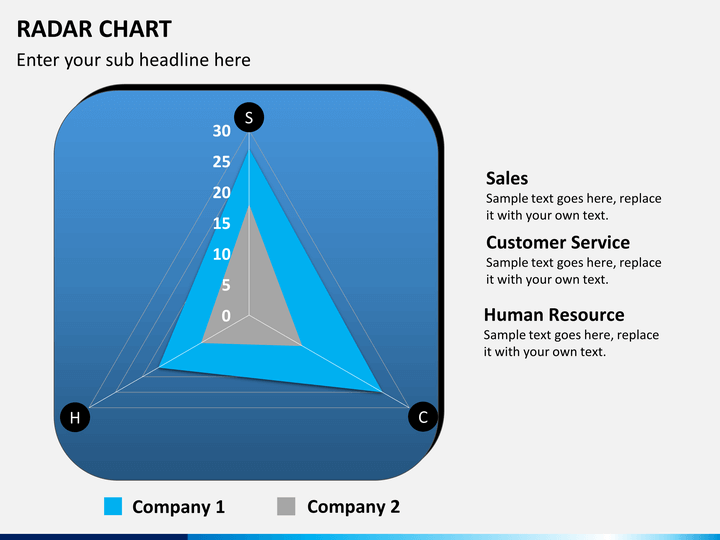
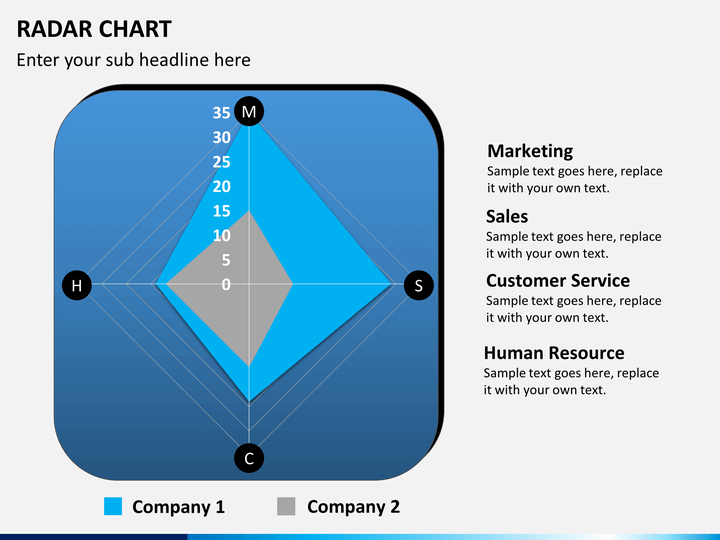
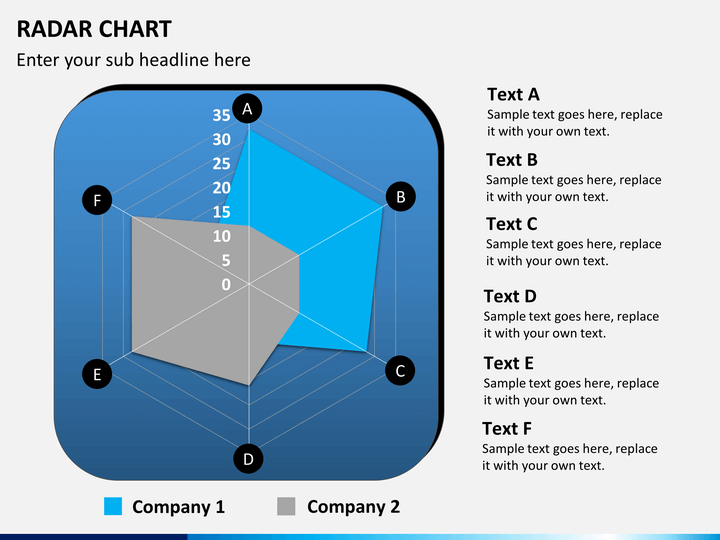
You can plan a brilliant presentation with this amazing template set and can compare multivariate data and present the facts and inferences in front of your audience. This set can be used to compare the growth or other perspective between two companies by using statistical data in the Radar Charts. Ample space has been provided next to these charts to write text which will explain the inferences of the chart and will convey them to your audience in an easy way.
About
A Radar Chart is a graphical method of displaying data in the form of a 2D chart where the multiple axes represent different parameters or variables. This Chart is highly effective in studying comparative data because the stats and data can be seen and understood simultaneously for different entities. These charts are also effective in studying the control of quality improvement and in displaying the performance metrics of an ongoing program. These charts are also known from different names such as spider charts, star charts, star plots, web chart, polar chart etc.
Write Your Own Review

Related Products


