
S Curve for PowerPoint and Google Slides
(8 Editable Slides)

S Curve for PowerPoint and Google Slides

SB586
Available For


Similar Products
- Sale

- Sale
- Sale


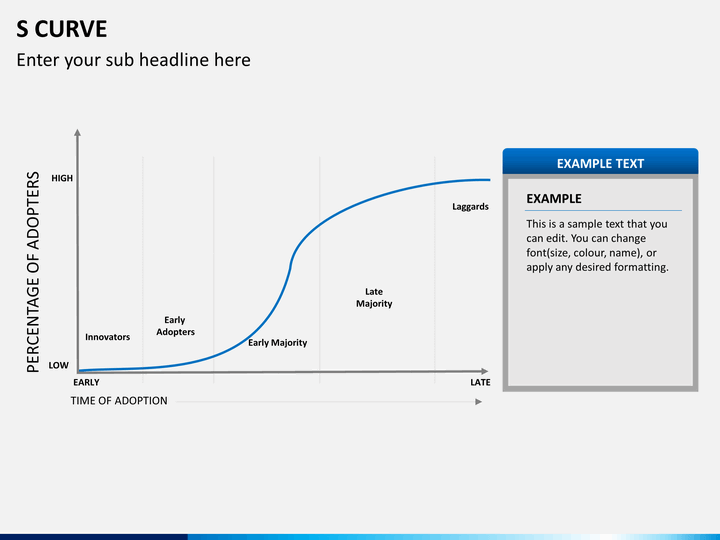
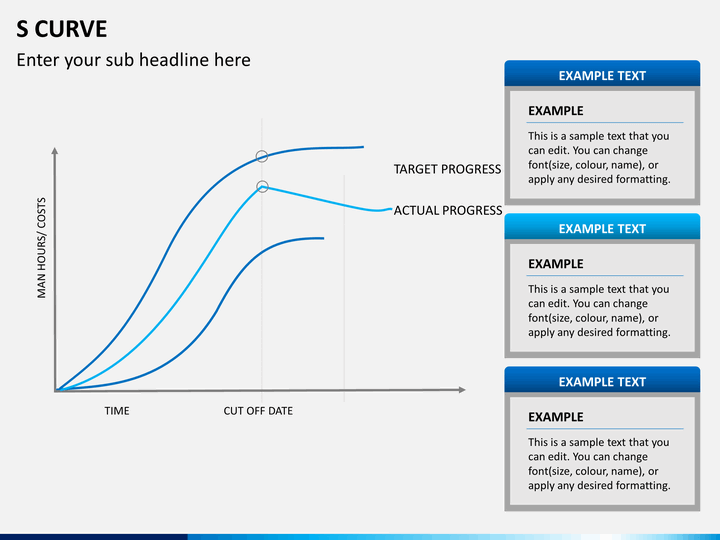
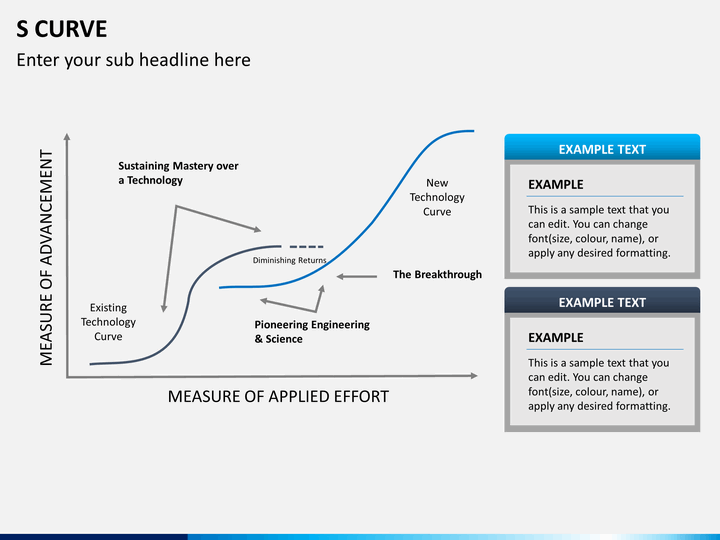
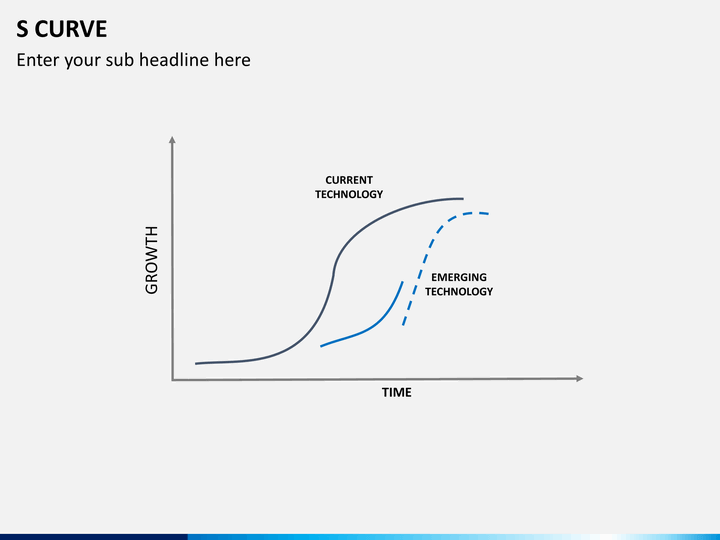
Sigmoid curve, or commonly known as the "S curve" refers to a special case of the logistics function. Usually, it defines the relationship between two parameters having real values and how a positive derivative takes place between the two of them at various points. Due to its peculiar shape, it is often associated with growth and change in many sectors. Today, the S-curve has definitely moved past its usage in mathematics and has become an integral part of various other vital topics. It is often linked with project management and is used to depict the growth in the matters of sales, population, currency, and so on.
Now, you can also link two vital properties together and show an exponential relationship between them using these readily available S Curve PowerPoint template. We have assembled a wide collection of various kinds of graphs and diagrams, depicting the peculiar nature of the sigmoid curve. It doesn't matter what kind of industry you belong to, but you can use this set over and over again. Professionals belonging to sales, marketing, finance, healthcare, academics, business development, and almost every other sector can have their own application related to this set.
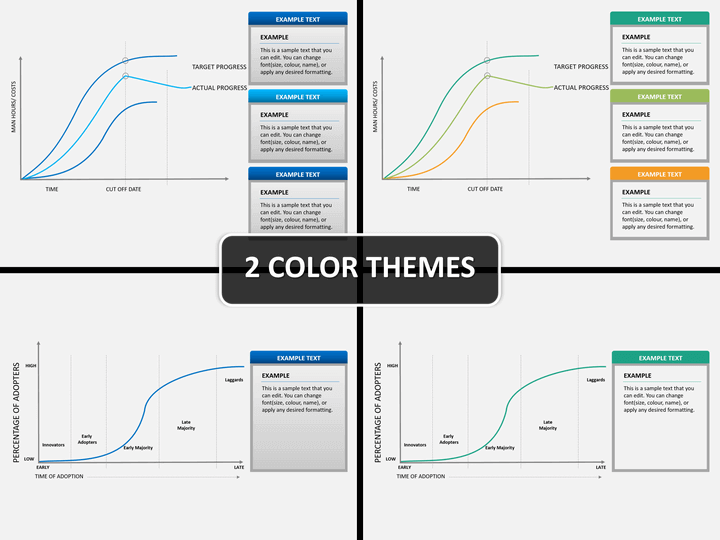
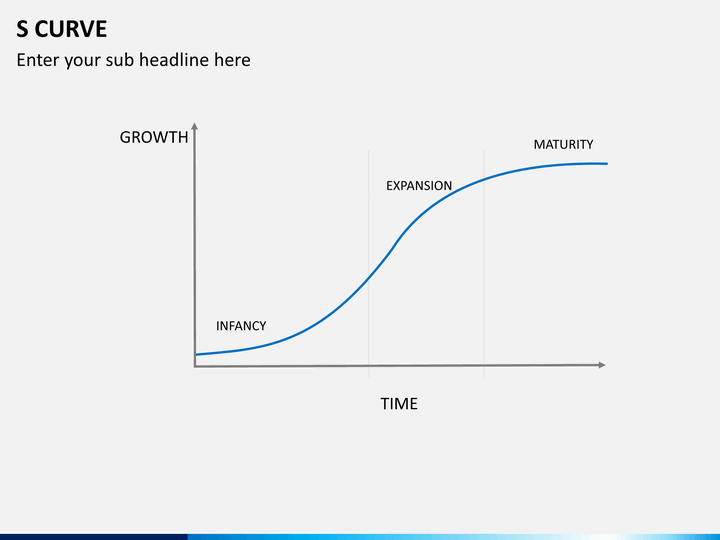
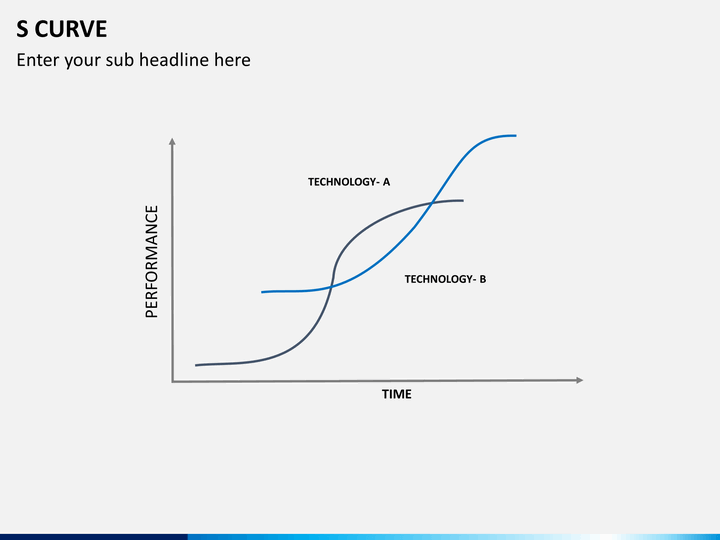
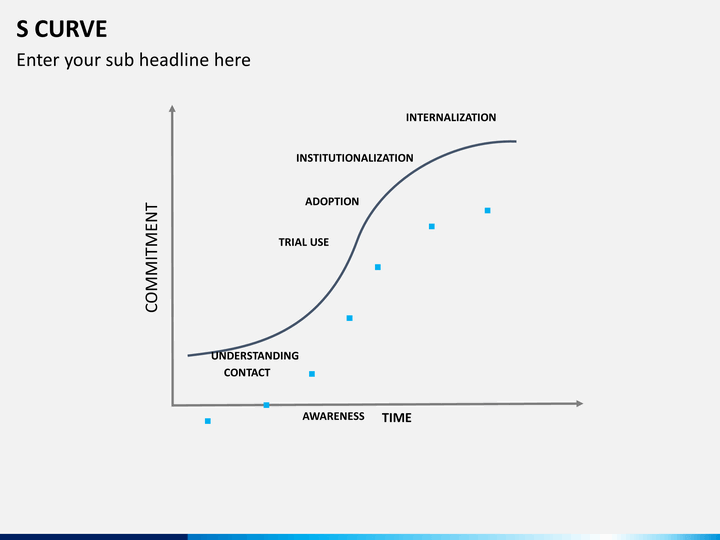
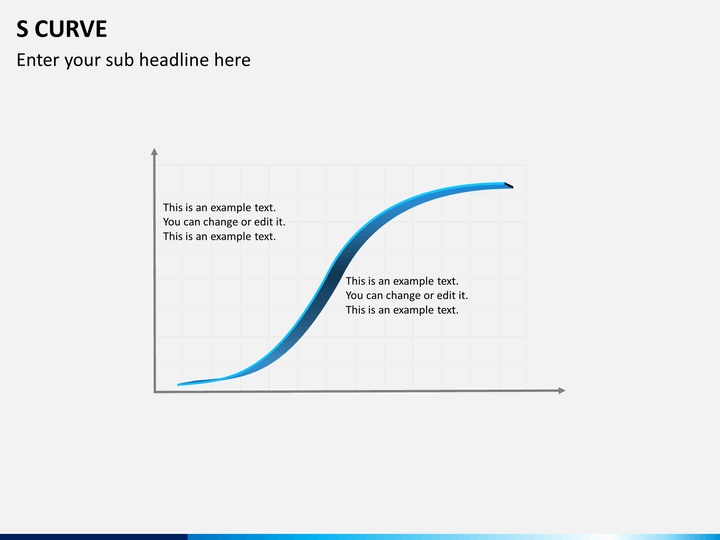
The template consists of different graphs that can be edited on the go. Simply provide your well-researched data and alter the graph as per your needs to customize it. The set has featured different kinds of graphs depicting the dynamic nature of the curve. From a simple sigmoid curve to the complex relationship between two or more curves, we have covered it all. We have already established the vital relationship between various entities like growth-time, performance-time, commitment-time, and so on in the set. You can simply explain the relationship between these entities to your audience using these professionally designed PPT slides.
With this essential set, you can save your time and let your audience know every crucial detail about a related subject. From your next sales plan to representing your well-researched data, there are endless of things you can do with this set. The template is entirely editable and comes in different color themes, so that you can pick the tone of these graphics easily. Just pick the illustration of your choice and include it in your next slideshow to impart a flawless touch to it.
Write Your Own Review

Related Products


