
Transformation Map for PowerPoint and Google Slides
(8 Editable Slides)


Transformation Map for PowerPoint and Google Slides

SB588
Available For


Tags:
Similar Products
- Sale

- Sale
Business Process Transformation PowerPoint and Google Slides Template
(14 Editable Slides)
- Sale

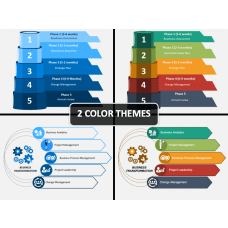

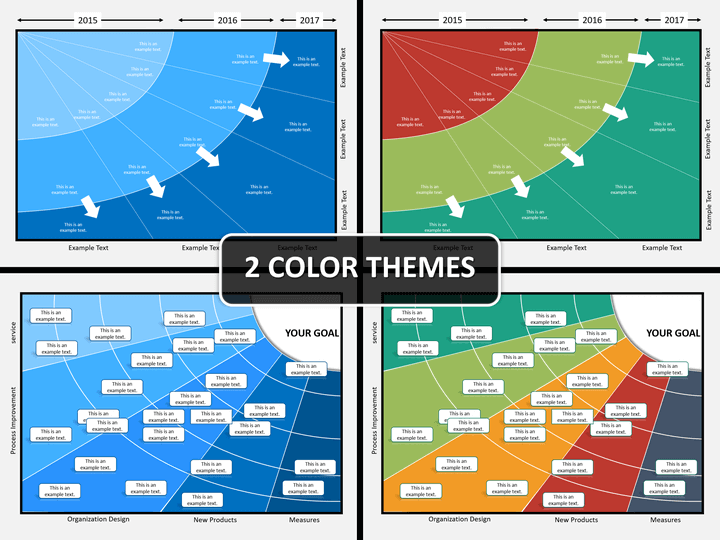
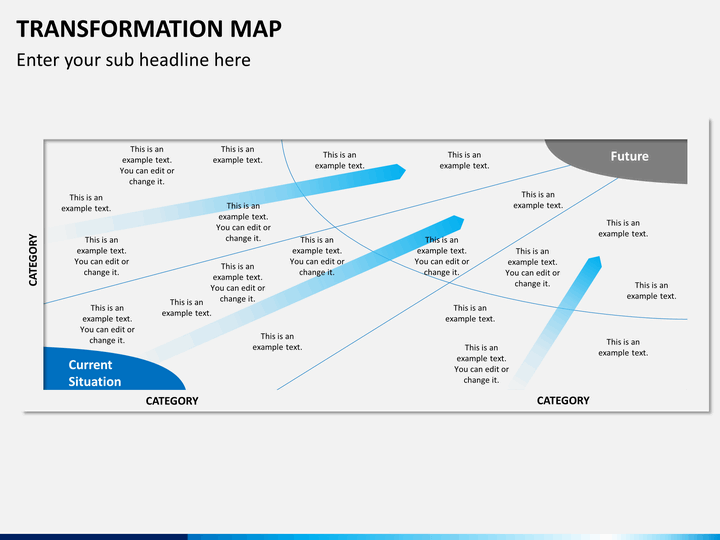
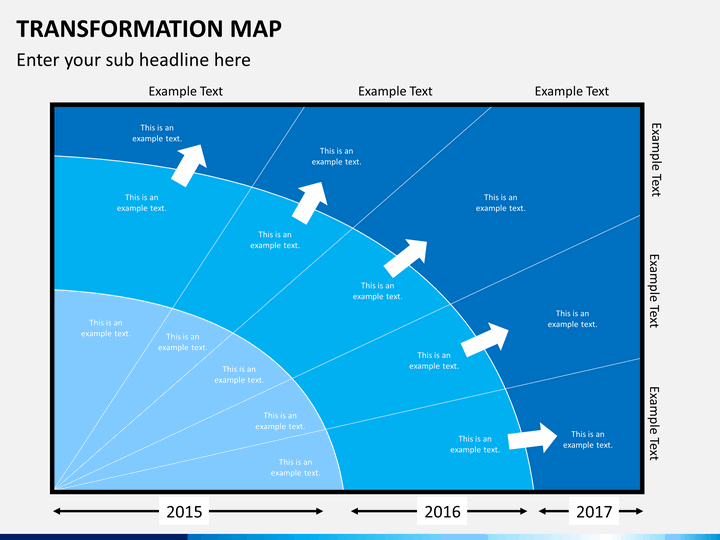
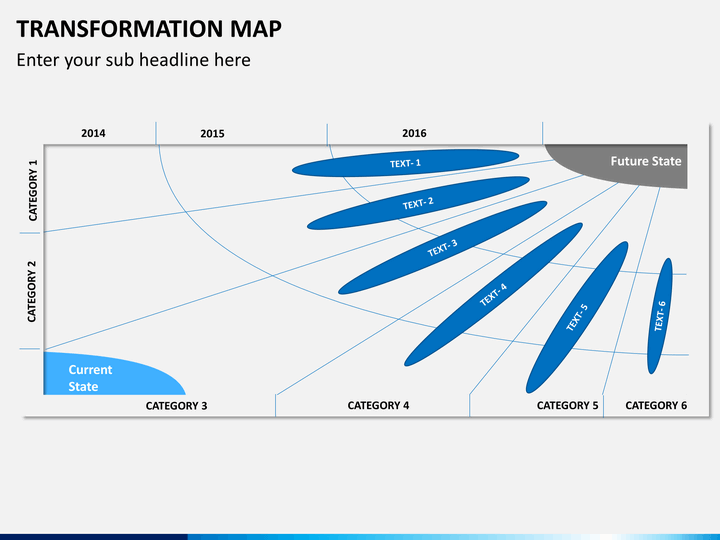
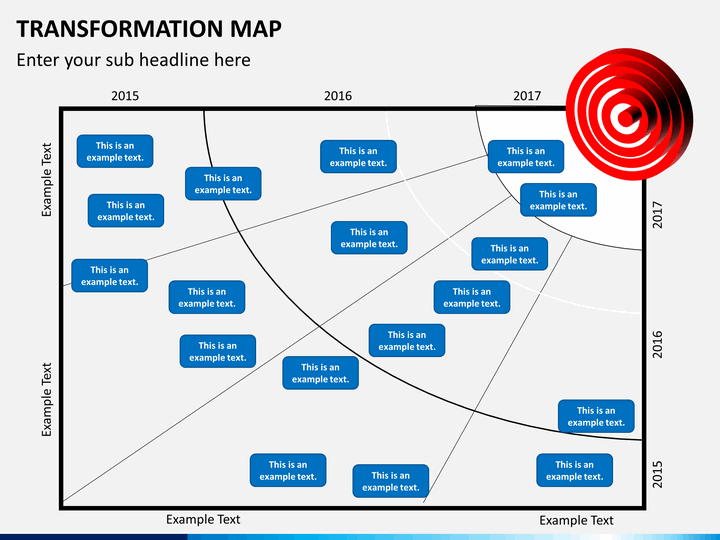
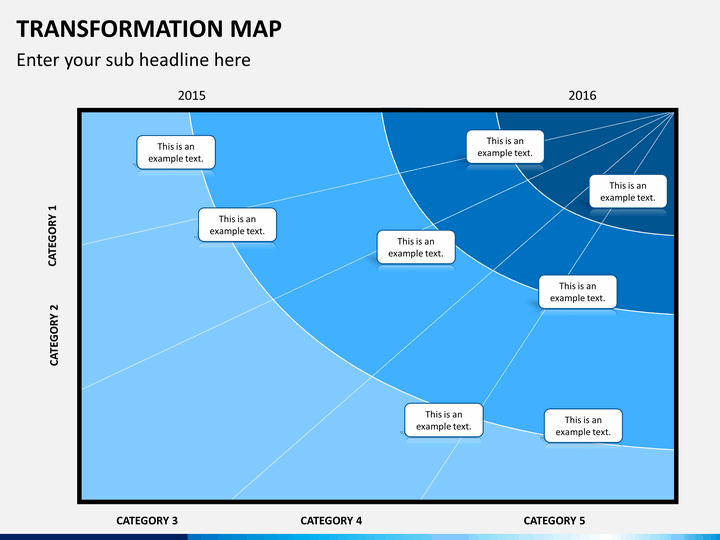
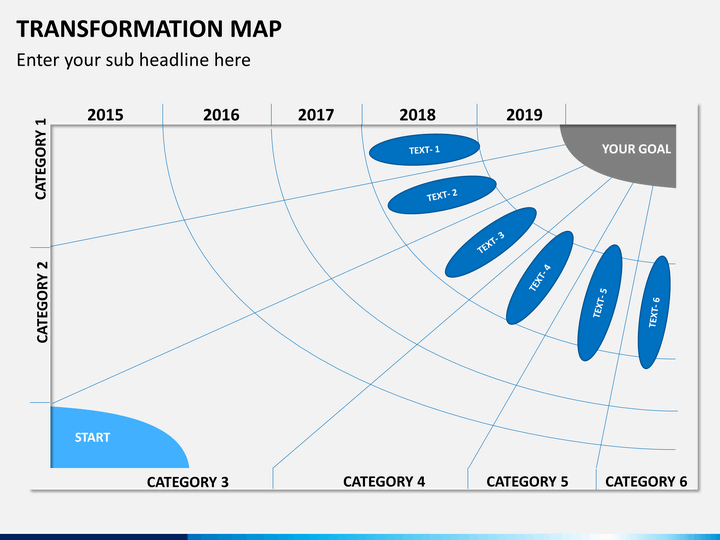
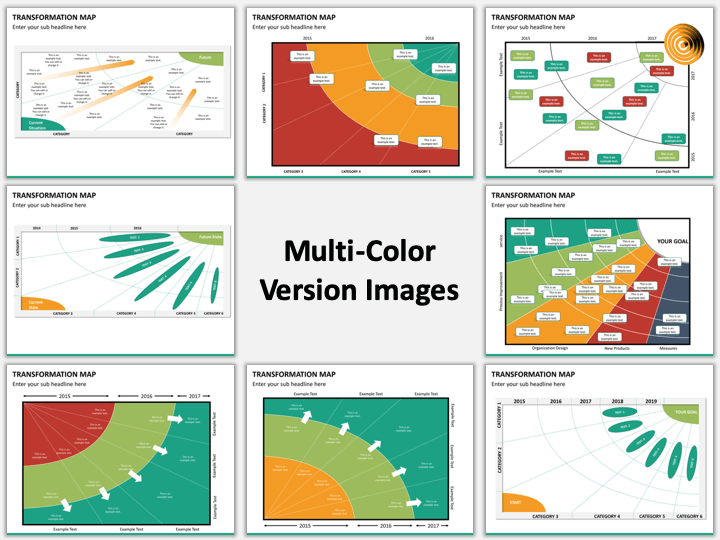
Our Transformation Map PowerPoint template depicts the process of transformation or change in any process or entity. The template set contains 8 editable PowerPoint slides which have been professionally designed and organized into sequence to help you deliver a splendid presentation. The set has graphs which depict the transformation stats beautifully. The marking and denotations have been made in different colors so that it is easy to understand the stats being shown in the presentation.
All the elements present in the slides are completely editable. You can easily edit the text boxes as well as the shapes according to your requirements and convenience. Our experts have designed the presentation in such a way that it caters your needs in the best way possible without much editing to be done. However, with the beautiful graphics present in the template you can deliver a splendid presentation in front of your audience.
All you have to do is to prepare awe-inspiring content for the presentation and this masterpiece template set will imbibe all your valuable information into itself. You will surely receive an applause after delivering your presentation and this is almost an assurance if you use this stupefying template.
About
Transformation Maps depict the changes in statistics for any particular process or event. It is used to study and compare the changes which have been recorded in data for a span of time. They allow the decision makers in a company to study accordingly the growth of their company or product and take appropriate steps according to the inferences from these Maps. These are an effective way to monitor the growth of any company or specific product by comparing the statistical data and making appropriate decisions to change the scenario of any downgrade.
Write Your Own Review

Related Products


