
Venn Diagram for PowerPoint and Google Slides
(8 Editable Slides)


Venn Diagram for PowerPoint and Google Slides

SB011
Available For


Tags:
Similar Products
- Sale

- Sale
-


Why to use Editable Venn Diagram PowerPoint Template & How it is Beneficial in Communicating Right Message?
With fully editable templates, you don't have to put in all your efforts in deciding how appropriate the designs are and how the graphical elements are suitable for your purpose. You just have to take a look at the available resources with you and match them with your subject matter and then slight amount of drag and drop here, quick editing in font, color and style there and finally with the addition of relevant text, you are perfectly ready to face your audience. To do this much, you surely don't need weeks of struggling around with the slide-designs nor is there any need of getting too absorbed with the graphical-creativity & aesthetic co-ordination and combination of various pictorial elements.
Putting it simply, you are free from all the disturbing burden of unnecessary things and get to concentrate well on the text that you want to add to your slides or the matter that you are going to speak on the D-day. This gives you more opportunity to make your presentation truly powerful with your message well-communicated.
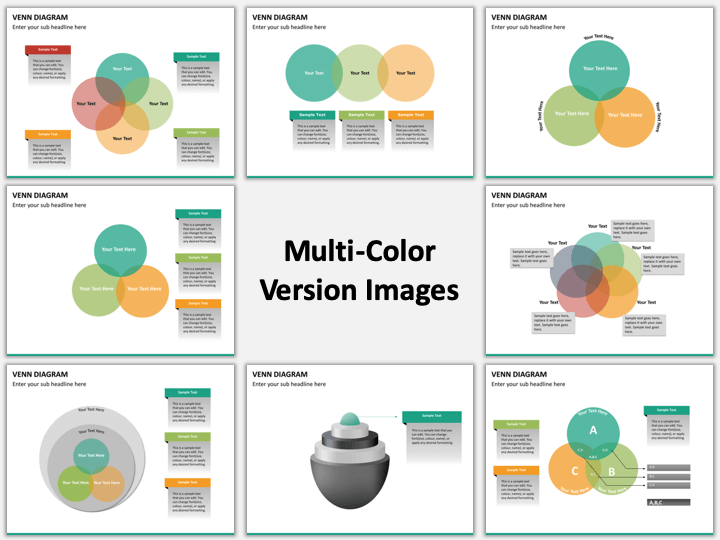
Importantly, you don't have to go with conventional Venn charts and old-school illustrations consisting of boring circles all put together in further boring way. You can pick a newer design with variety of shapes and backgrounds. You have special placeholders for adding text and so much more; if you choose a professionally built template instead of doing it all on your own from the very beginning.
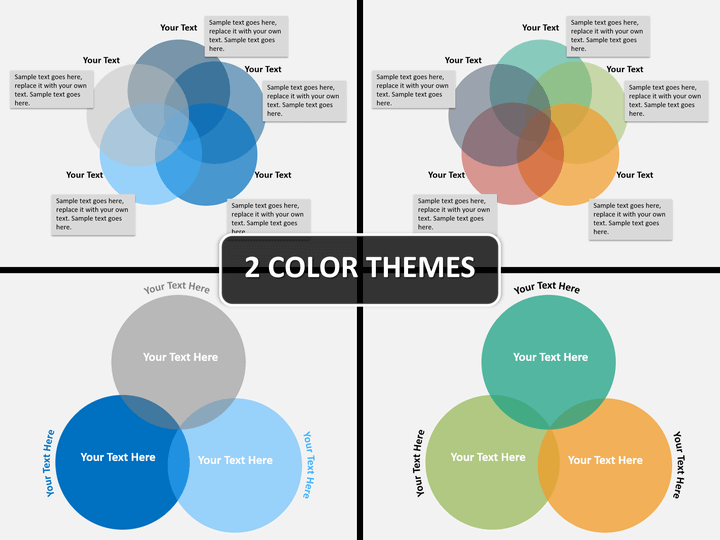
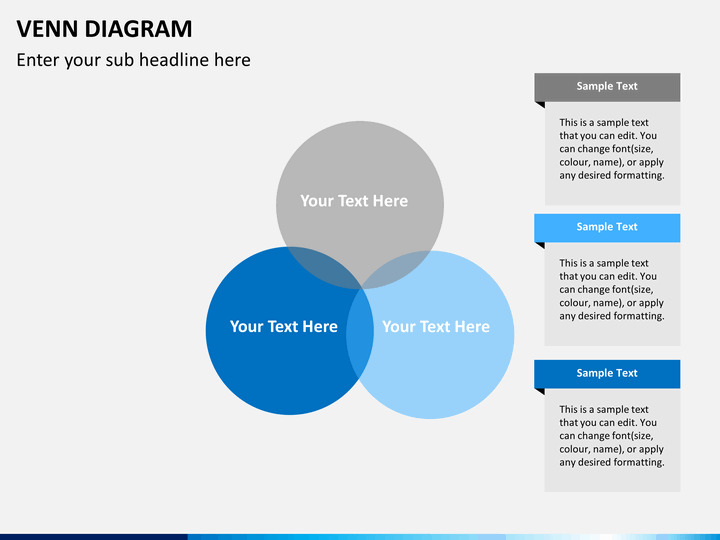
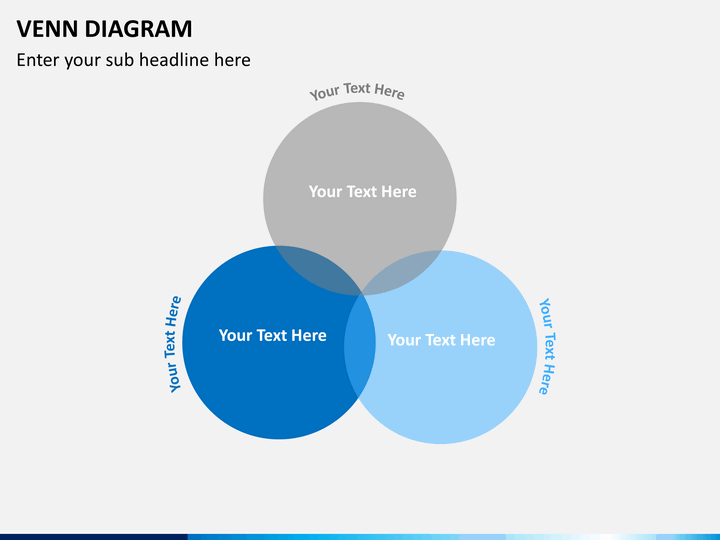
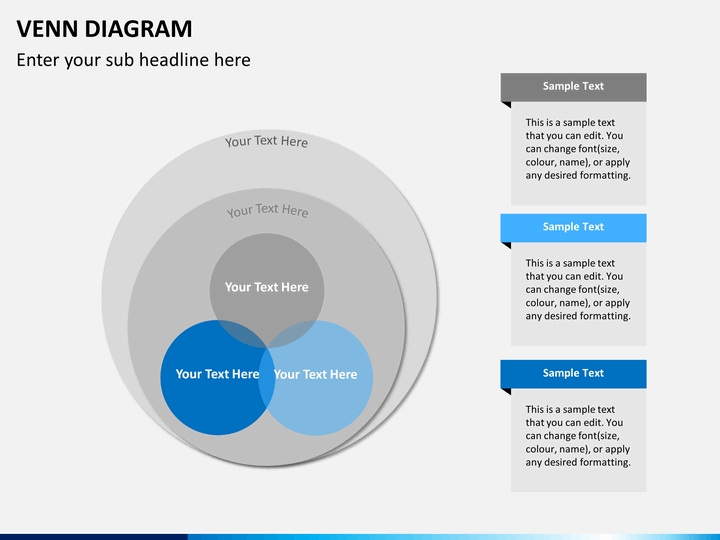
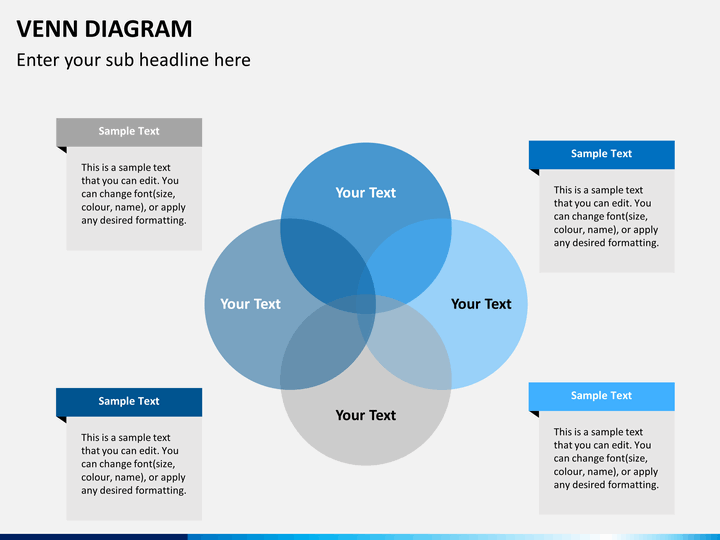
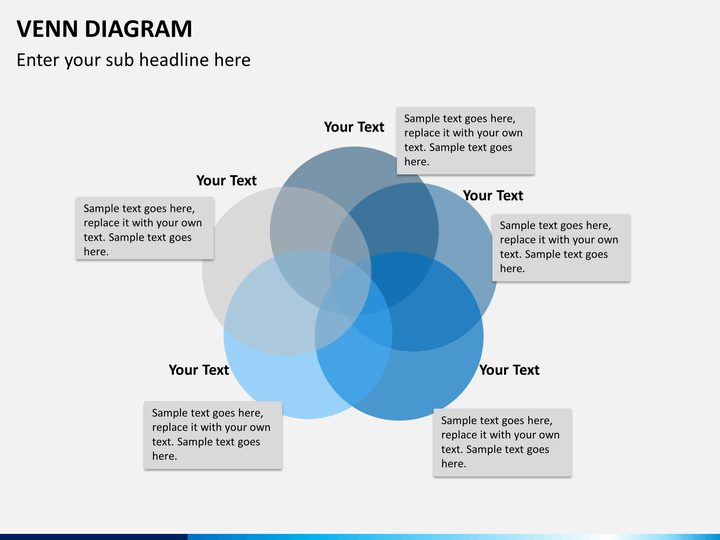
About Venn Diagram
A kind of graphical illustration created by the overlapping circles used for displaying the similarities, differences or some kind of relationships between different data sets or groups, when they share some common qualities but still comprise of other differences. Developed by John Venn, it formed an inseparable part of Set Theory, thus, also known as Set Diagram, now used across various fields for various reasons. The intersecting portions of the circles represent the similarities and the non-intersecting portions constitute the differences.
Why to Use Venn Diagrams in Presentation
Simply because they serve as one of the most useful and intelligently illustrative graphics organization tools, especially, when you are comparing, contrasting or bringing out relationship between two or more things, places, subjects or people and so on, they are best visual aids for your presentation or talk.
Starting from the field of scientific researches, engineering, computer sciences, mathematics, and statistics to business processes, marketing, social sciences, politics, law, medicine and life sciences, it proves a most useful tool that eases up exhibiting any relation that you want to establish between different elements.
So, whether you want your marketing team to know how different market sectors have certain things in common and how that can prove beneficial for your business growth or you want to guide your human resource department to utilize the common skill sets of employees from different departments, in every such case, Venn diagrams will make it easier for you to clarify your point better.
Furthermore, if you are a teacher trying to help the students of your class to understand specific topics and the compare and contrast certain things or show the relation between various different groups of things such as what's common in amphibians and reptiles or how automobile engineering is different from robotics, and so on, you will be able to communicate your message in a more understandable manner.
Write Your Own Review

Related Products


