


Similar Products
- Sale

- Sale
-

Want your website performance report to leave a better and long lasting impact on your audience? Let our professionally created PowerPoint Visitor Statistics and Graph Template accompany your presentation and you’ll be explaining at your best. Being technologically sophisticated and uniquely innovative, you’ll get complete freedom to maintain your creativity. Each of the slides on the set is fully editable. This is because of the vector technology that works behind the making of the template. So, you don’t just get to edit every inch of the designing elements but get to do it with complete ease. You get the same amount of ease when it comes to content addition. This saves a lot of your time and efforts.
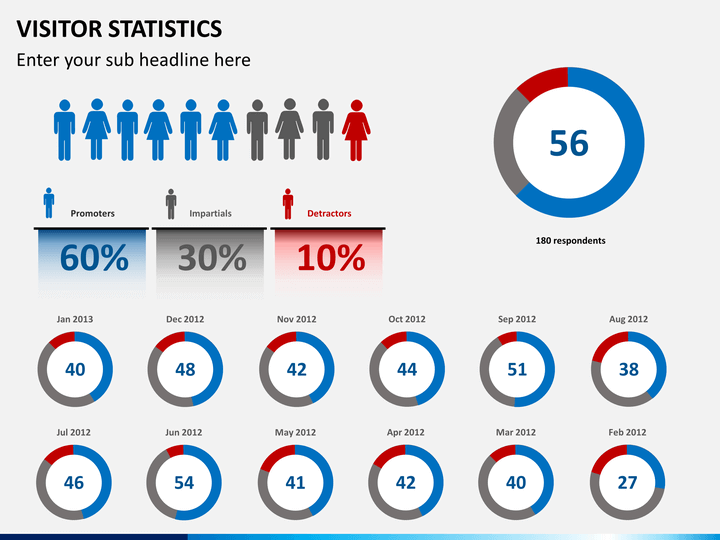
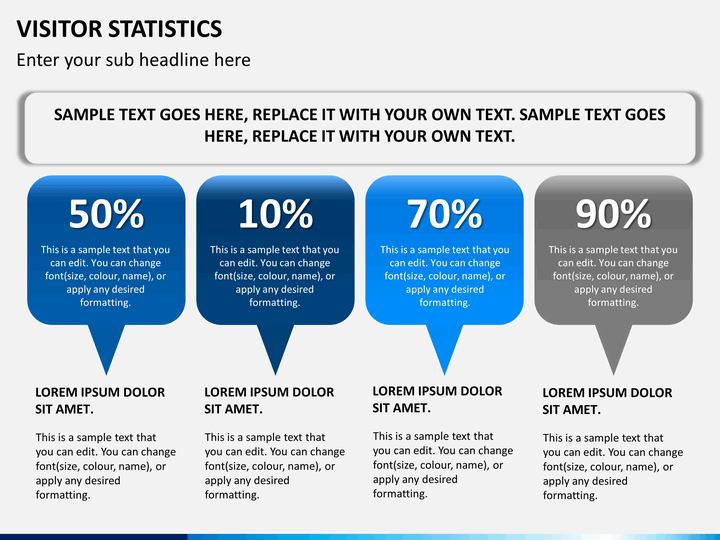
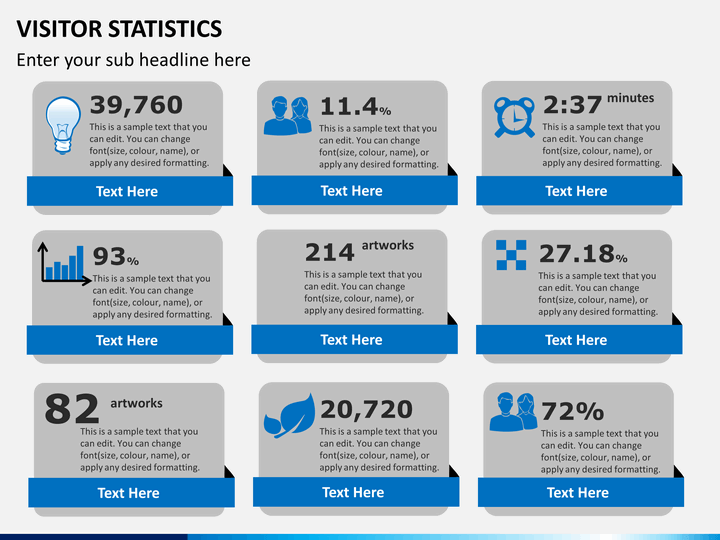
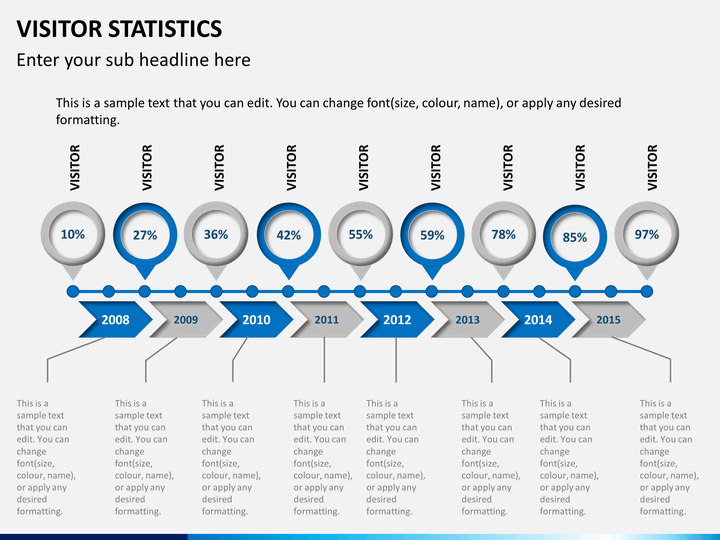
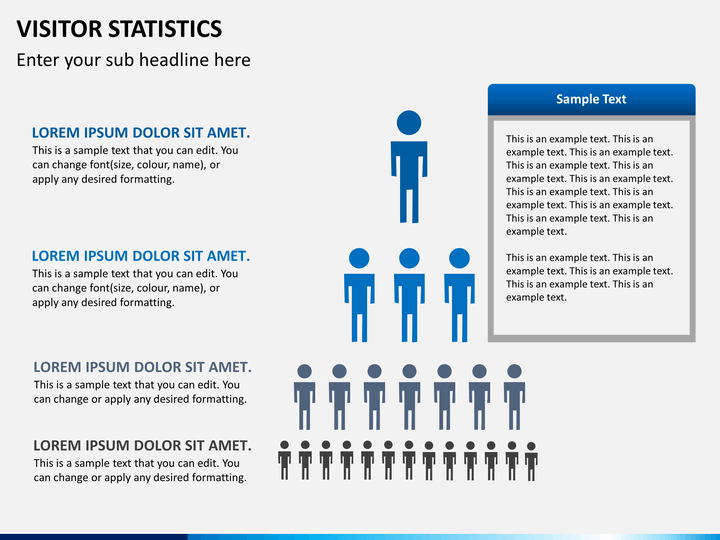
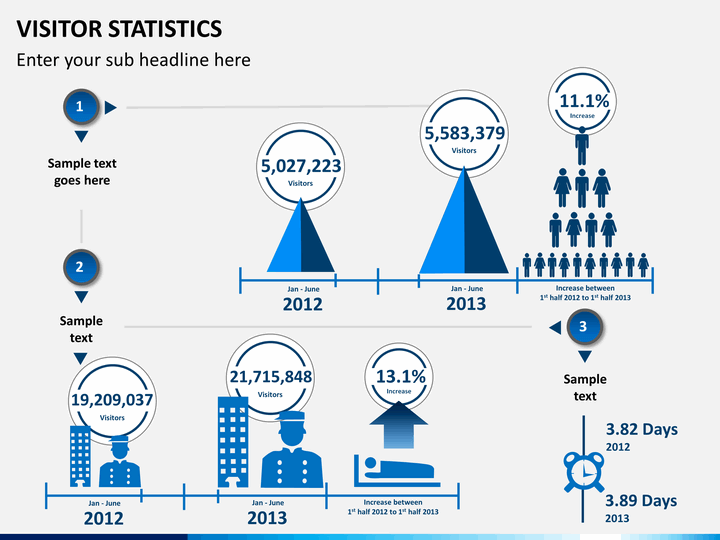
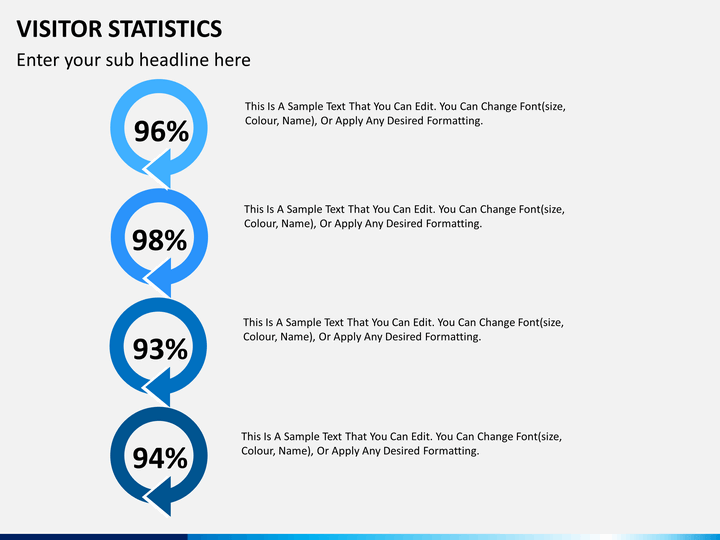
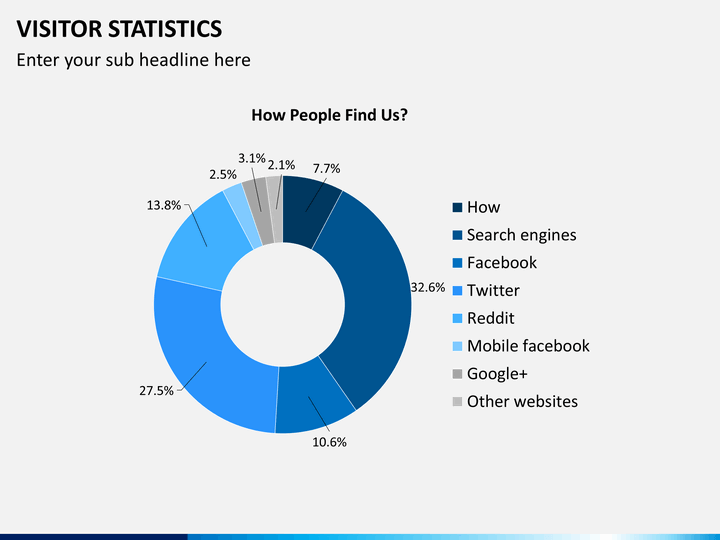
The set is basically ready-to-use this means you can directly include it on your presentation without any hassle. You don’t just get saved from the messy job of creating slides right from the scratch but also get to add visual appeal to your message. It proves a brilliant way to represent all the activities taking place on your website. Starting from illustrating the traffic sources to depicting the frequency and statistics of the visitors, the template lets you present it all. There are several individual slides on the set that offers you a way to display all possible elements of Internet marketing. So, you can explain any of the points like bounce rate of a certain page, activity on your landing pages, demographics and location of the visitors, their conversion ratio; in-page analysis and so on.
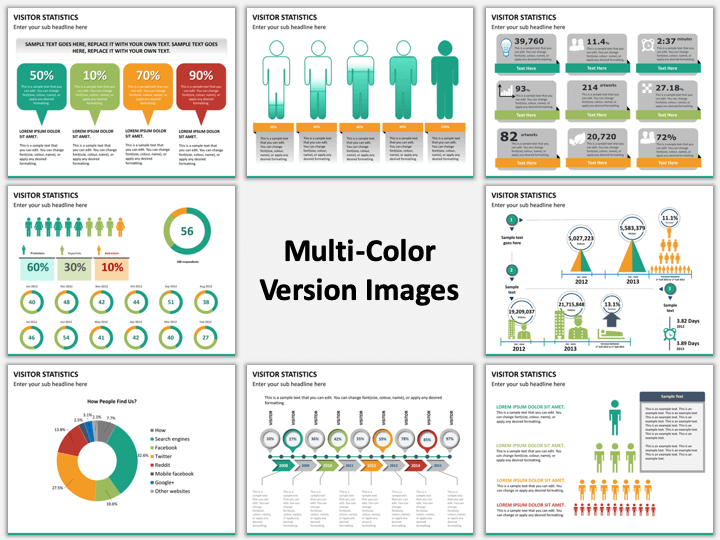
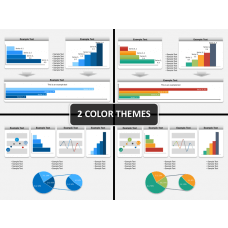
The set is utterly flexible and versatile. This makes it perfect for all the related themes that you deal with. You can consider it as a complete marketing research visualization tool and mold it the way you want. By giving a slight touch up and including your text you are ready to face your audience. So, go ahead and leave an everlasting impact on them.
About
It is always important to keep track of visitors for an online business portal. You may either have an online version of your brick-and-mortar shop or a completely Internet-based store. Your site can be offering anything starting from information and news to products and services. In every case, you’ll need visitors to gain popularity and value of the website. Same is true when you are involved in online promotional activities. Visitor Statistics and Graph proves a perfect solution for maintaining a record of how well your site is doing. Whether you are to explain your Internet marketing goal to your team or show your partners or clients how your online business is working. Displaying the information using the stats and graphs will prove handier in every case.
Write Your Own Review

Related Products


