
Waterfall Diagram PowerPoint and Google Slides Template
(13 Editable Slides)


Waterfall Diagram PowerPoint and Google Slides Template

SB045
Available For


Similar Products
- Sale

- Sale
-
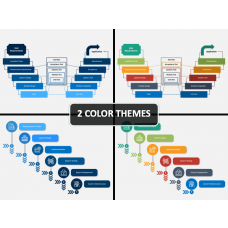
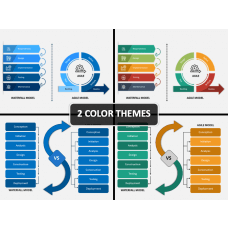

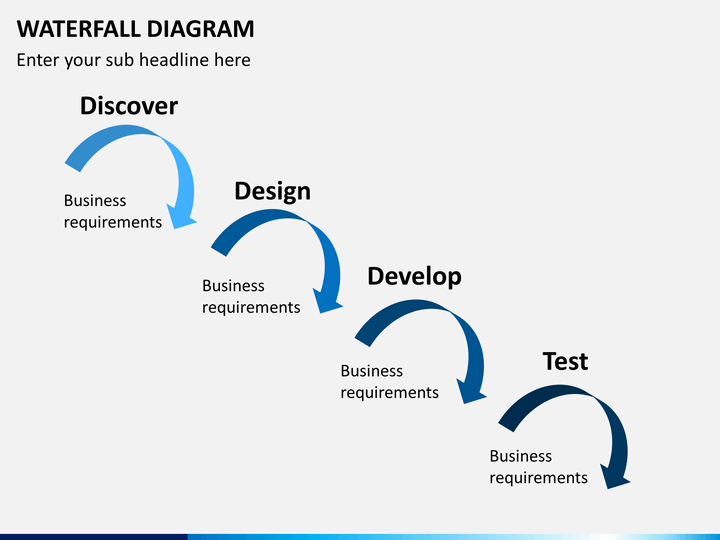
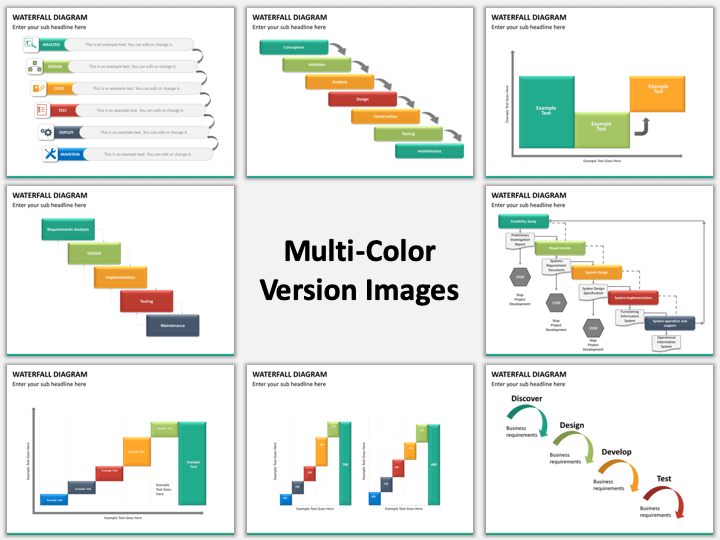
Waterfall Diagram is an effective way to illustrate the changes as well as the contributions of certain individual components on an initial value leading to final state. However, it is not available as a ready-to-use version in PowerPoint suite as default. This means, you have to create them on your own making a lot of efforts. This is why, we bring to you pre-designed PowerPoint Waterfall Diagram. Based on vector technology, all the slides are completely editable. Apart from that, you don't even have to get stuck with formatting part. Our professionally built diagrams are pre-formatted. So, you can directly incorporate them into your presentation.
Whether you are to describe the revenues and costs of your company or the financial changes taking place over the years, your task will be only to prepare the content and not to hassle with designing basics. From illustrating the inventory audits to company net profit; retained revenues to performance analysis, you can do it all, in just a matter of few minutes. Editing is a breeze with complete command over all the things like design elements, background, layout, colors and so on. There is no need to feel bad about the placement of your text as you can place it exactly where you want.
So, instead of spending hours in creating your visuals from scratch, simply spend a few minutes in editing and be ready! The template consists of most innovatively designed slides. Thus, your visuals are unique, appealing, and truly impressive. Get ready just in no time and make your presentation a real hit!
About
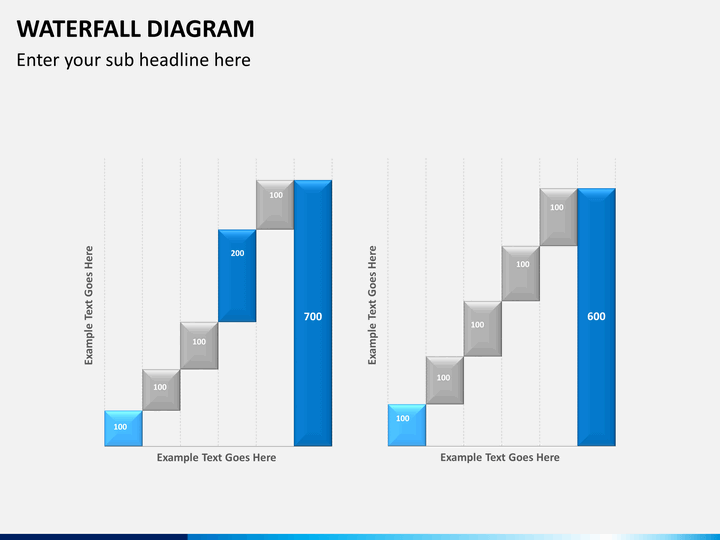
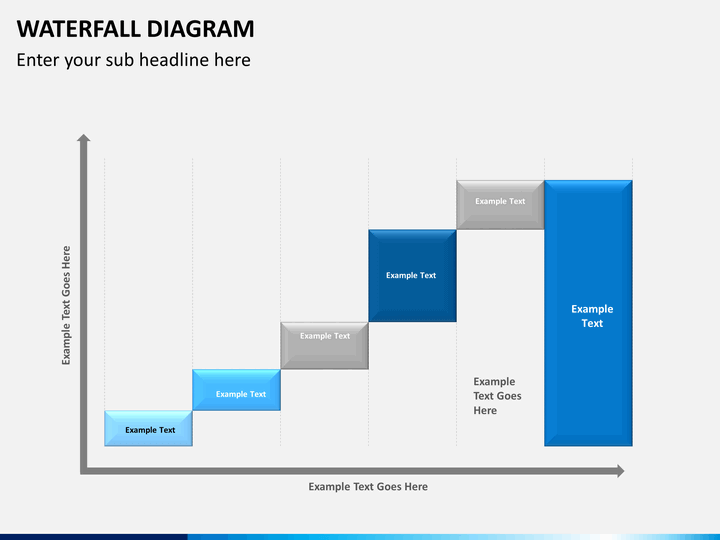
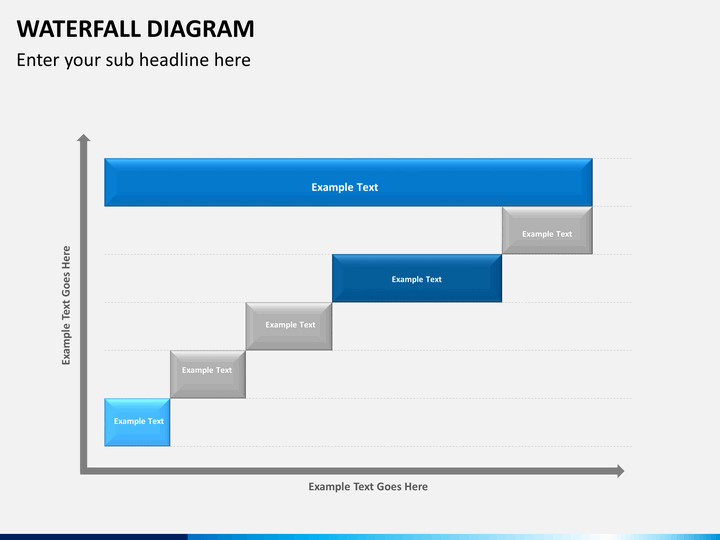
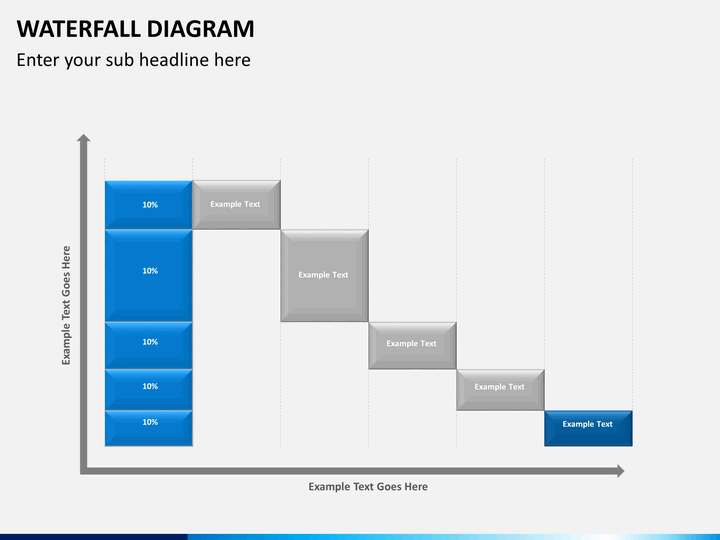
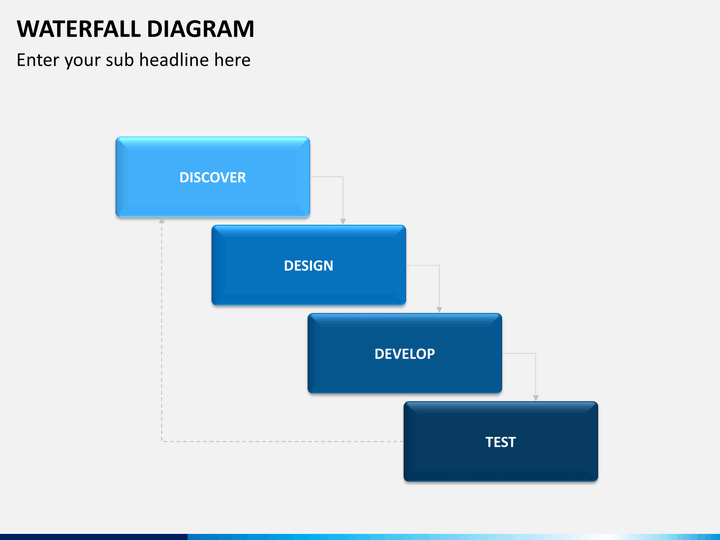
Waterfall Diagram can be defined as a kind of data visualization that uses breakup effect. Its main purpose is to determine the cumulative effect caused by sequential introduction of positive or negative values. In other words, it is a way to illustrate the final changes brought to an initial value because of a series of intermediate values that can be both positive and negative.
Sometimes, it is also called Flying Bricks Chart as it consists of different blocks that look like brick-like-structure suspended in the air. The other names by which it is known include - Cascade, Mario and Bridge Chart. It is best used for various analytical purposes. Also, it is quite popular among the finance and business analysts as well as among the sales fraternities.
Write Your Own Review

Related Products


