


Similar Products
-

-
-
-
- Sale
- Sale


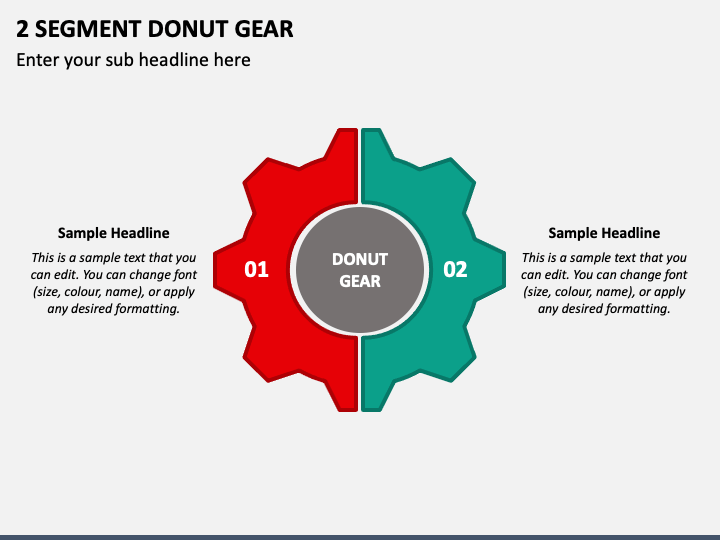
Use our 2 Segment Donut Gear presentation graphic for PowerPoint and Google Slides to give your information a clean and structured look, helping the audience process it quickly. This dynamic slide features a gear infographic divided into two segments and editable text placeholders.
Professionals from different backgrounds can use this graphic in their presentations to visually emphasize the relationship between two data sets or concepts. Business professionals can use this stunning illustration to depict a comparative analysis of two products or services in terms of features, benefits, or customer satisfaction. Additionally, the graphic is the perfect visual aid to illustrate pros and cons, problem and solution, cause and effect, opportunity and risk, and many more concepts.
Best-in-Class Features
- The graphic will look the same across all screen sizes.
- Even if you lack technical skills, modifying this visual is a breeze.
- The infographic has been carefully crafted to steer clear of copyright violations.
- You can approach our 24*7 available customer support executives to get a quick turnaround to your queries.
Make room for this eye-catching infographic in your presentations to facilitate easy understanding and impress your viewers!
Write Your Own Review

Related Products


