


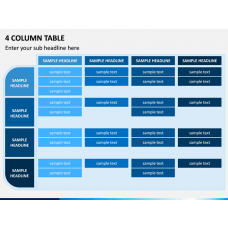
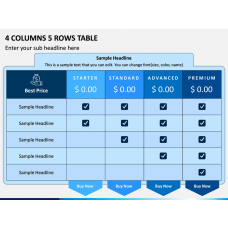
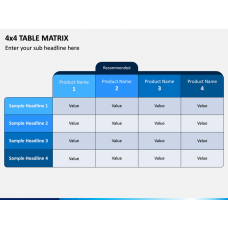
Similar Products
-

-
-
-
-
- Sale

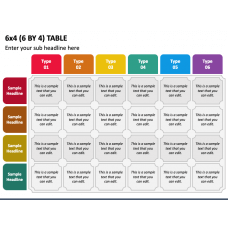

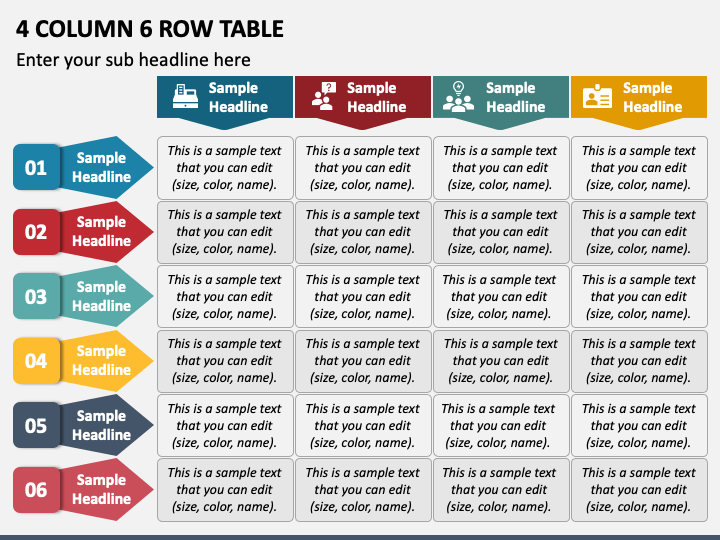
Get our 4 Column 6 Row Table presentation graphic for PowerPoint and Google Slides to make your information stand out and facilitate easy understanding among your audience. The fully editable table illustration can help sales professionals and business analysts depict the quarter-wise performance of company subsidiaries, stores, or products, highlighting increase and decrease by changing the cell’s background color or text.
Product managers and business development executives can use this infographic to highlight the comparison of features, prices, and other attributes of different products and services. Moreover, the graphic can be used to portray survey results, project timelines, etc.
Impressive Features
- You don’t require special tools or editing experience to customize the graphic.
- Downloading the PPT allows you to leverage it for a lifetime without encountering any restrictions.
- Each object has been designed after thorough research to keep copyright issues at bay.
Download this feature-rich slide to simplify the representation of complex text and add a touch of creativity to your lackluster presentations!
Write Your Own Review

Related Products


