


Similar Products
-

- Sale
-
-
- Sale
- Sale

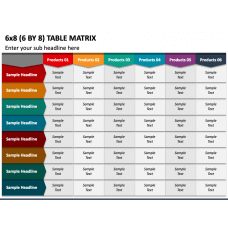
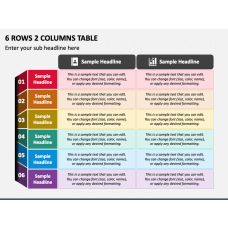

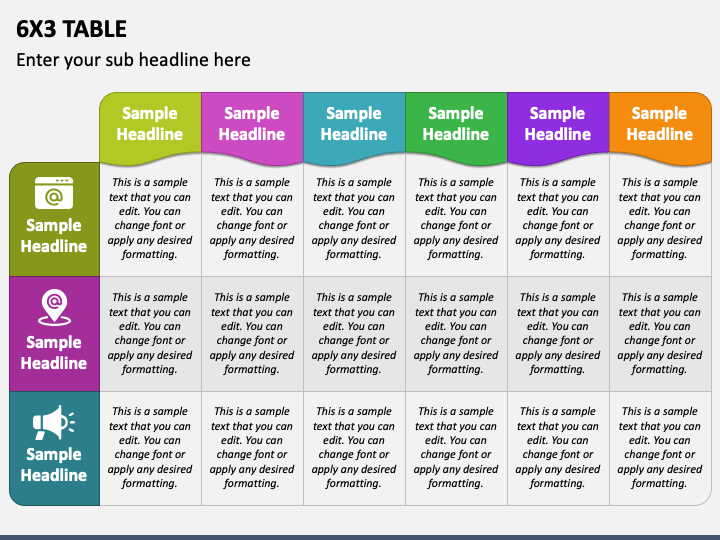
Our multi-purpose 6x3 Table presentation graphic for PowerPoint and Google Slides is now up for grabs! Get it now to present your information in an organized way, ensuring easy comprehension. The slide features an editable tabular infographic with six columns and three rows.
Sales professionals can leverage this illustration in their presentations to creatively portray sales data, such as revenue, number of units sold, and profit margin over a period of time. Business development executives can use this infographic to illustrate a comparative overview of products or services based on various characteristics. In addition, you can capitalize on this visual to display project status, survey results, and a lot more.
Best-in-Class Features
- Prior editing knowledge or specialized skills are not necessary to customize the graphic.
- The visuals are designed to provide uninterrupted resolution across all screen sizes.
- There is no scope for copyright issues as the illustration is created carefully from scratch.
- Customers can rely on the 24/7 available customer support staff for prompt assistance.
Elevate your presentation’s look using this table illustration featured in this PPT!
Write Your Own Review

Related Products


