


Similar Products
- Sale

-
-
- Sale
- Sale
- Sale

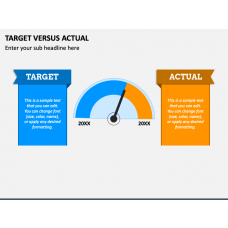
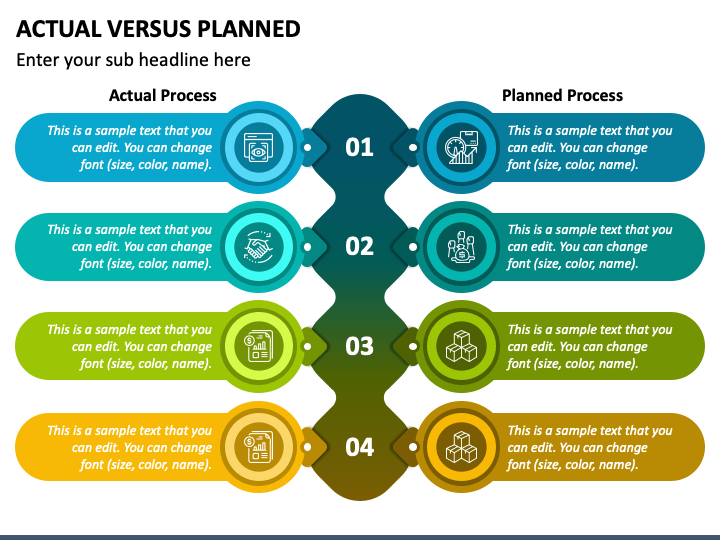
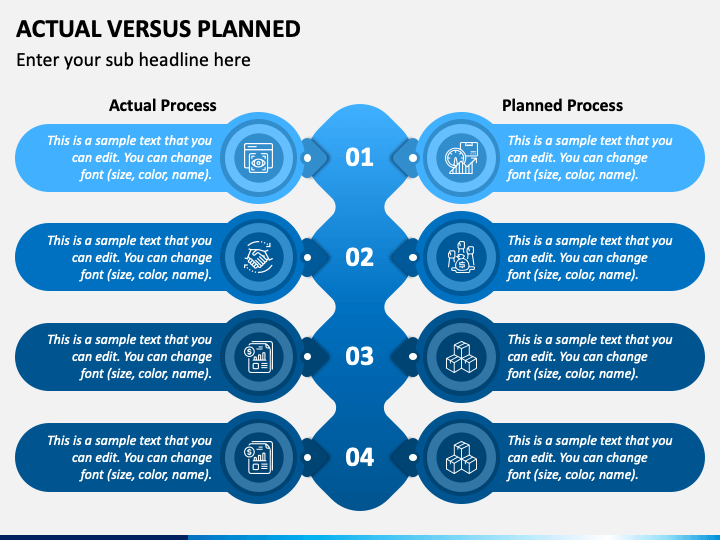
With our all-new Actual vs. Planned PPT template, you can illustrate the process or department-specific comparison of what was forecasted and how it really turned out to be. Using this editable deck, senior executives and market and financial analysts can display the reasons for the gap between expectations and accomplishments. You can further use this set to describe how strategists can leverage the difference between actual and planned outcomes to review progress and set future goals accordingly.
What’s Inside the PowerPoint Slides?
The set comprises a tabular illustration and a uniquely designed infographic. These are adorned with vibrant color schemes and stunning background themes. Moreover, each visual is accompanied by text placeholders where you can put your desired content.
Key Features
- The users can conveniently modify all attributes without comprehensive technical skills or external aid.
- The visuals are crafted with a higher resolution to ensure they look the same on all screens.
- Everything is meticulously researched; therefore, the presenters won’t come across copyright breach issues.
- Our round-the-clock available customer care team can be approached anytime without any hesitation.
Download our pre-designed deck to deliver meaningful and insightful presentations in no time!
Write Your Own Review

Related Products


