


Similar Products
- Sale

- Sale
- Sale
- Sale
- Sale
- Sale


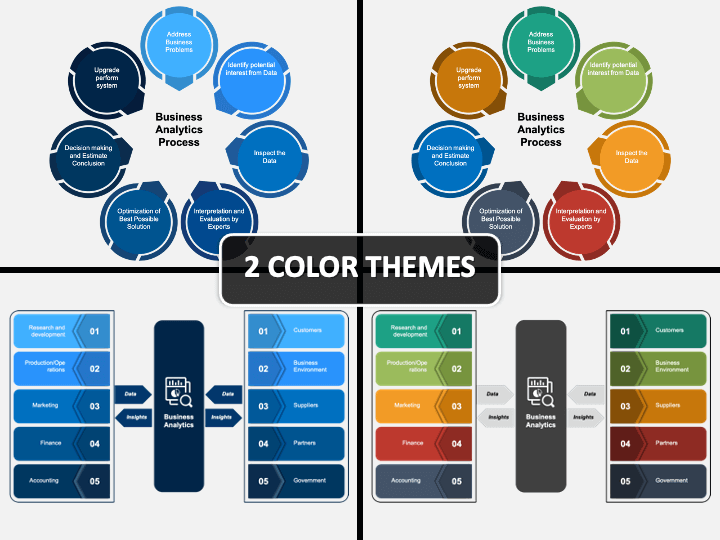
Use our Business Analytics PPT template to explain how businesses can analyze their historical data with the help of technologies and statistical methods to gain strategic insights for decision-making. Data and business analysts can use this entirely editable deck to discuss how this process helps companies identify and anticipate business outcomes & trends and facilitates smart, data-driven decision-making. You can also use this set to highlight how enterprises can tap into modern business analytics tools to enable measurable analysis and accurate predictions in specific business areas like finance, marketing, human resource, etc.
Create a powerful slideshow with our template, comprising stunning visuals & user-friendly functionalities, and deliver presentations that are pleasing to the eyes and easy to craft. The slides are easy to download, edit, and share, so get the deck and craft engaging slideshows way faster than ever!
Key Highlights of the PPT
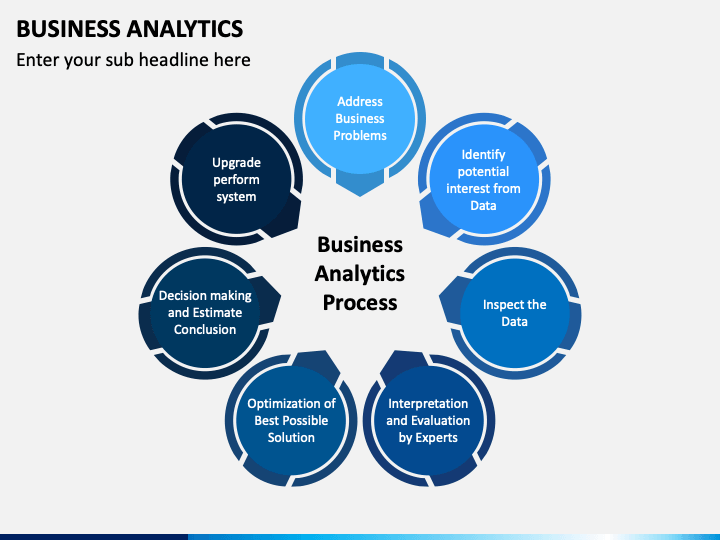
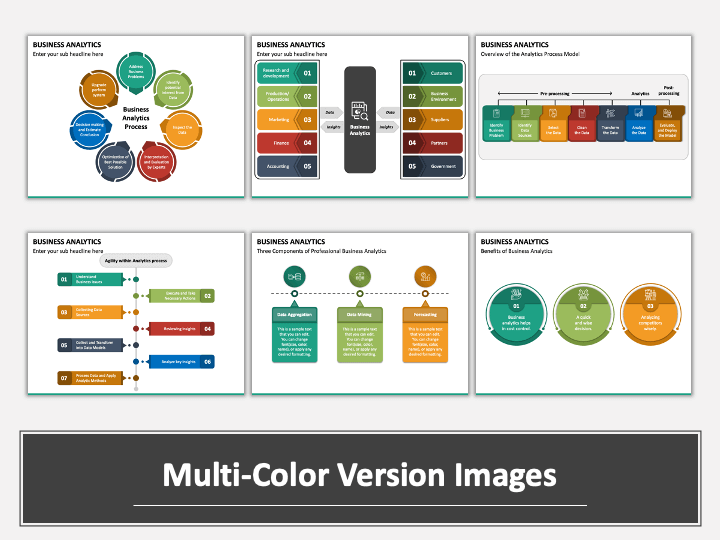
- A beautifully-designed pattern with distinctly colored circles and arrows depicts the process precisely.
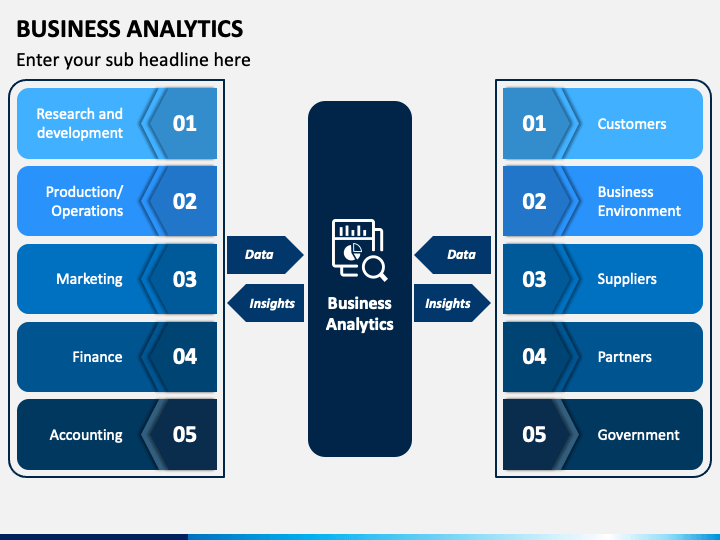
- A comprehensively-designed infographic illustrates how the system of insights drives business actions with people, processes, and technology.
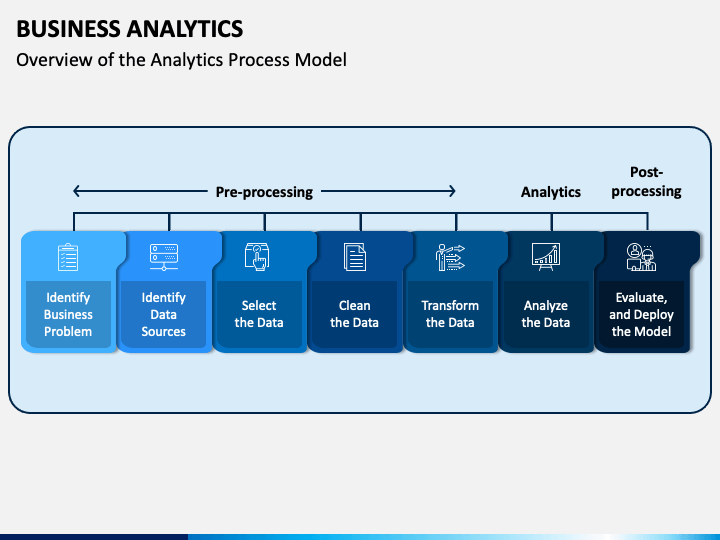
- A figure with relevant vectors gives an overview of the analytics process model.
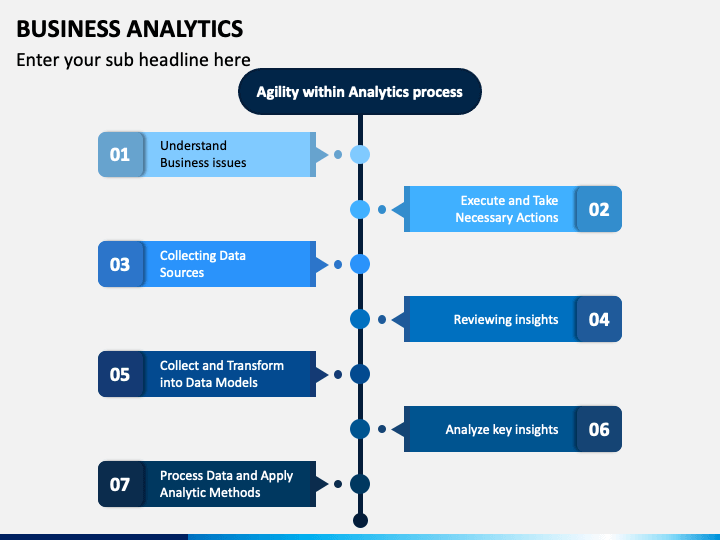
- An infographic describes the steps to improve agility within the analytics process in an easy-to-understand manner.
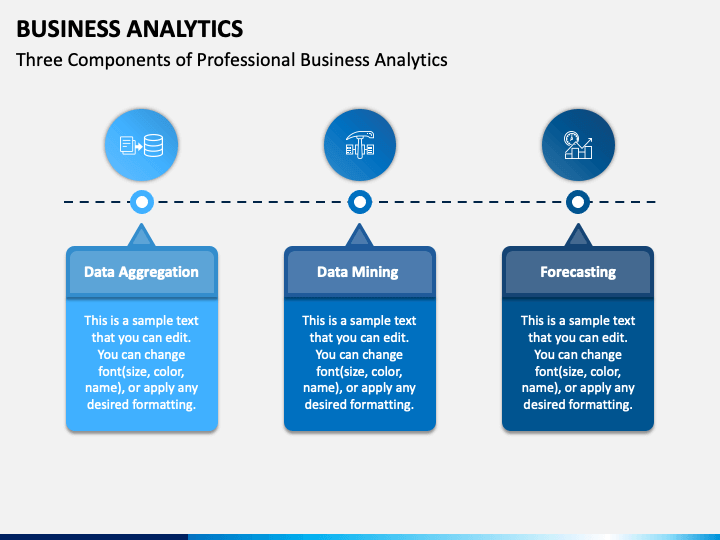
- Three components of professional business analytics, i.e., Data Aggregation, Data Mining, and Forecasting, have been illustrated through an infographic.
- An infographic with differently shaded circles and appealing icons depicts the benefits of business analytics.
A Plethora of Useful Features
- Save time & effort with the 100% customizable slides, which can be edited without any prior editing skills.
- Since the PPT has been designed by our in-house designers after meticulous research, there will be no issues pertaining to copyright.
- 24*7 availability of customer support team is assured to resolve your queries at the earliest.
- The spellbinding layouts come with unlimited use.
Download these stunning slides and impress your viewers!
Write Your Own Review

Related Products


