Business Cycle PowerPoint and Google Slides Template
(7 Editable Slides)
Business Cycle PowerPoint and Google Slides Template
Available For
-
-
-
-
-
Business Process Improvement (BPI) PowerPoint and Google Slides Template
(15 Editable Slides)
-
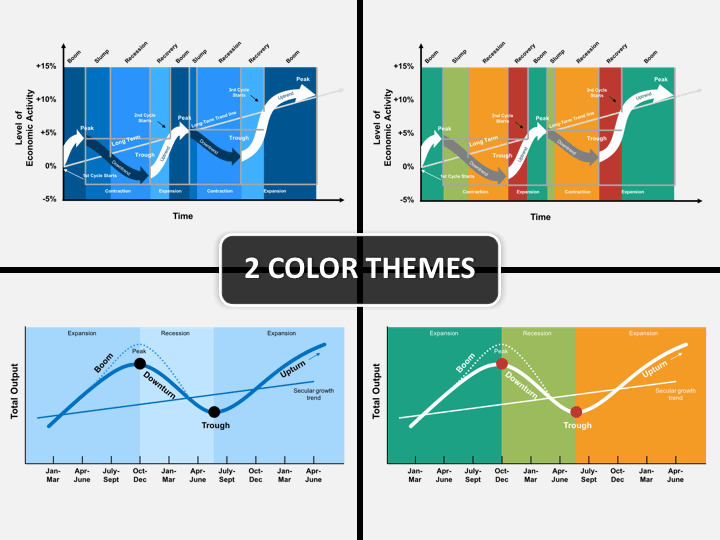
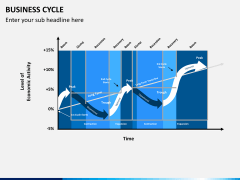
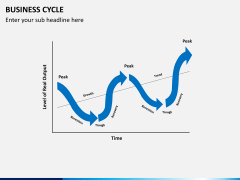
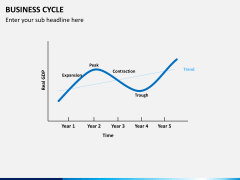
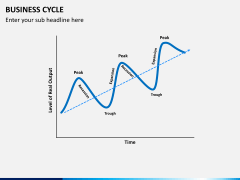
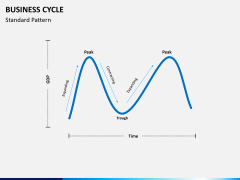
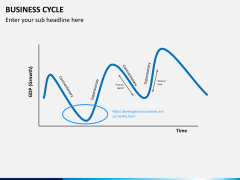
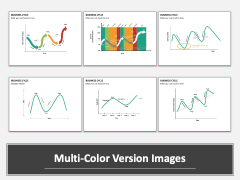
The business cycle is the graphical representation of various upward and downward movements of different interrelated entities, such as GDP, growth, time, etc. It is the pictorial representation of how these various business entities are connected to each other. Different financial or fiscal entities are also represented at times with the help of these diagrams. Henceforth, it is also commonly known as an economic cycle. Most of these parameters are mapped over a shift of time, so that a period of change can be represented. These graphs are ideally used to identify the growth or loss in any business. With such a wide usage, these illustrations will make an essential place in your files for sure.
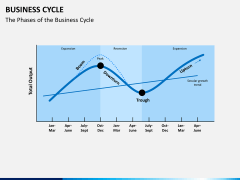
We have come up with a well-researched and professionally designed Business Cycle PowerPoint template that consists of different graphical representations. Use these readily available PPT slides and explain a recession or expansion phase in no time. It doesn't matter what kind of industry you belong to, it can't survive without a business model. With the help of these high-definition graphics, you can easily link different entities together and represent them in a flawless manner. It holds an utmost importance for business analysts, company owners, project managers, department heads, consultants, and almost every individual who deals with these crucial business factors.
It doesn't matter if your audience is your fellow stakeholders or a group of prospective clients - you can certainly win them over with these visual aids. Not only will these vector-based illustrations make it easier for you to explain something to your audience, but they would also be able to retain every piece of information in a trouble-free way. Designed with perfection, the template set consists of different kinds of graphical representations that can help you explain this concept to your audience. You can also alter these diagrams on the go and provide your own data to draft a flawless presentation.
With these thoughtfully crafted and entirely editable slides, you can depict a relationship between different parameters like GDP-time, economic growth-time, output-time, and a lot more. It comes in different color themes, so that you can alter these illustrations to go with the overall voice of your organization. An entirely editable set, it can be altered easily. From changing its layout to its background, you can do it all without any trouble. Save your time and resources while drafting your next slideshow on business cycle using this remarkable set.

