


Similar Products
- Sale

- Sale
-
- Sale
- Sale
- Sale


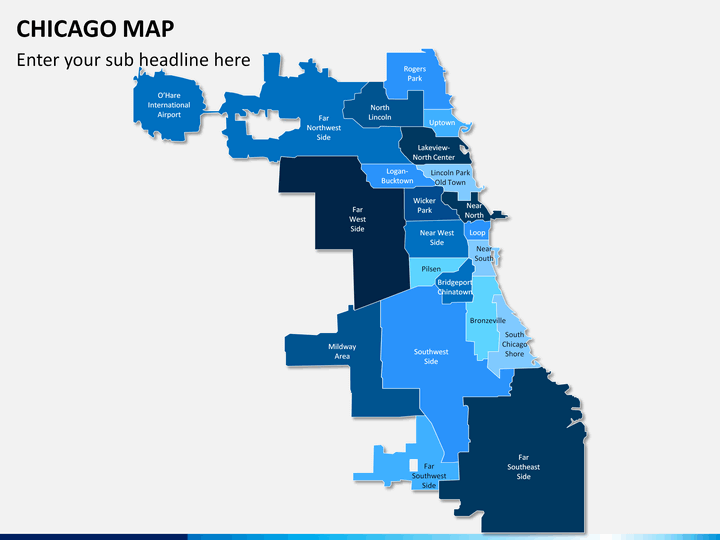
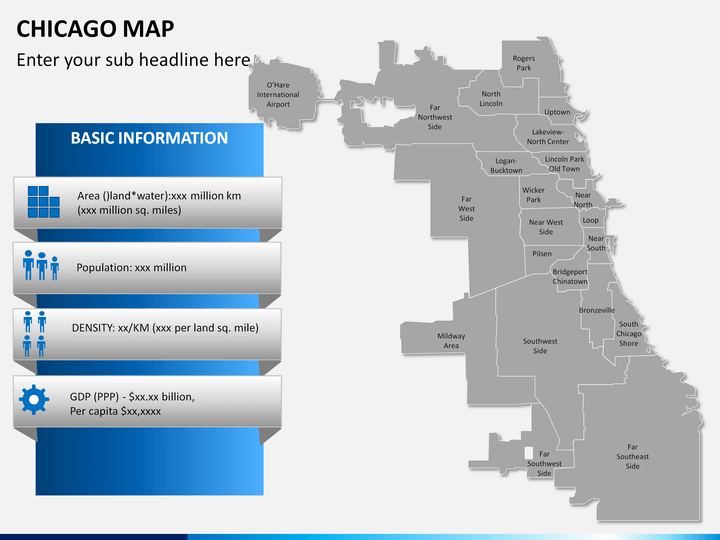
The third most populous city in the United States, Chicago is considered as a cultural and business hub of the Midwestern region. While the city is home to over 2.7 million people, the metropolitan area (which is also known as Chicagoland) has over 10 million residents. Incorporated way back in 1833, it is one of oldest major cities in North America. One of the most advanced cities in the world, it is also known for the incident of the Great Fire that led to the reconstruction of some of its major parts. If you also like to depict any kind of information related to the city, then you can simply take the assistance of this readily available Chicago Map PowerPoint template.
A highly informative set, it will help you provide your well-researched data regarding the city of Chicago without much trouble. To fulfill your needs, our experts have drafted this comprehensive set of Chicago maps. If your organization is associated with any other firm that is based out of this region, then this would be an ideal set for you. Furthermore, it can also be used to present any kind of data related to the city in a visually stunning manner. From corporate professionals to educators, everyone can use this set in their own way.
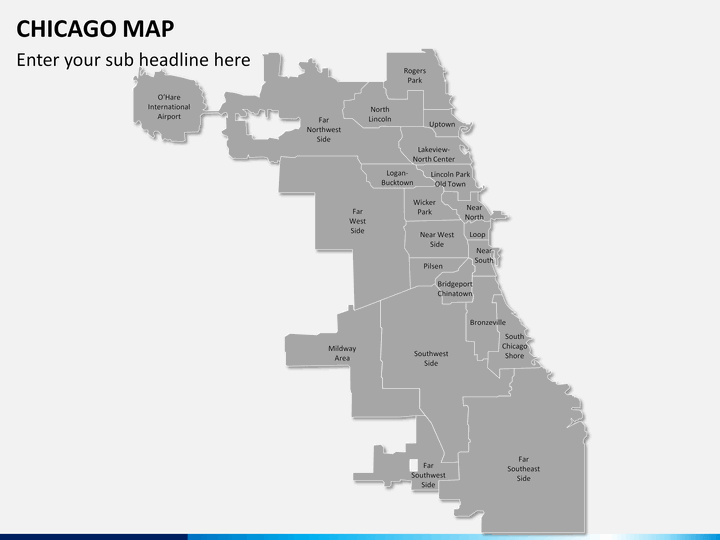
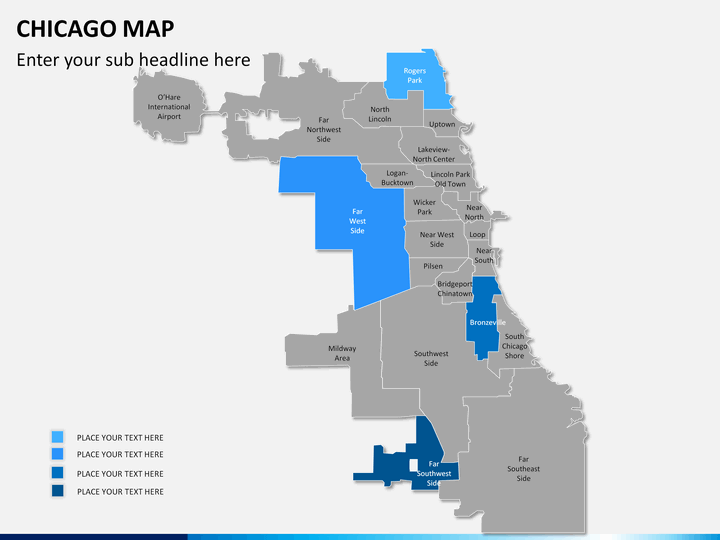
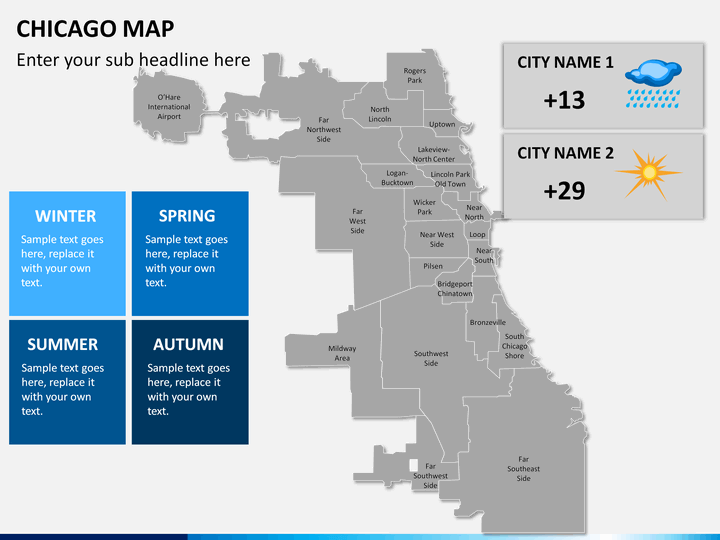
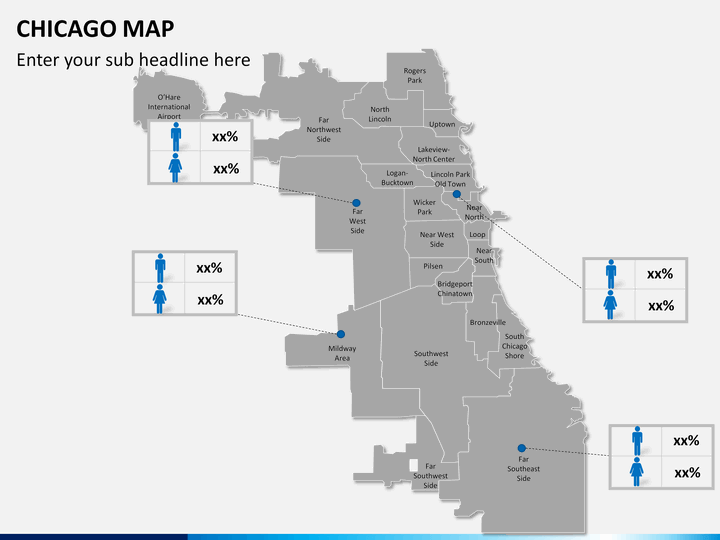
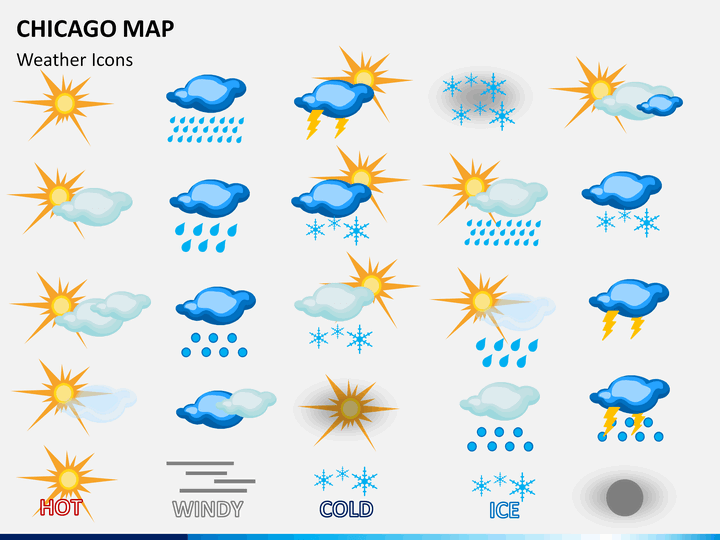
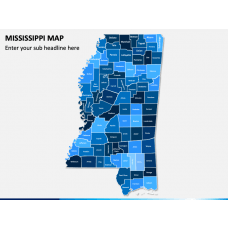
Instead of spending hours to draft Chicago map, simply take the assistance of this readily available set. The city is divided into 77 divisions and several community areas. With the help of these maps, you can represent them all without much trouble. You can present any demographic information related to the region or provide weather statistics with these illustrations. Furthermore, you can simply zoom any region in order to focus it. All the major regions and community areas have been segregated in these maps. This will make it easier for you to represent your data in a trouble-free manner.
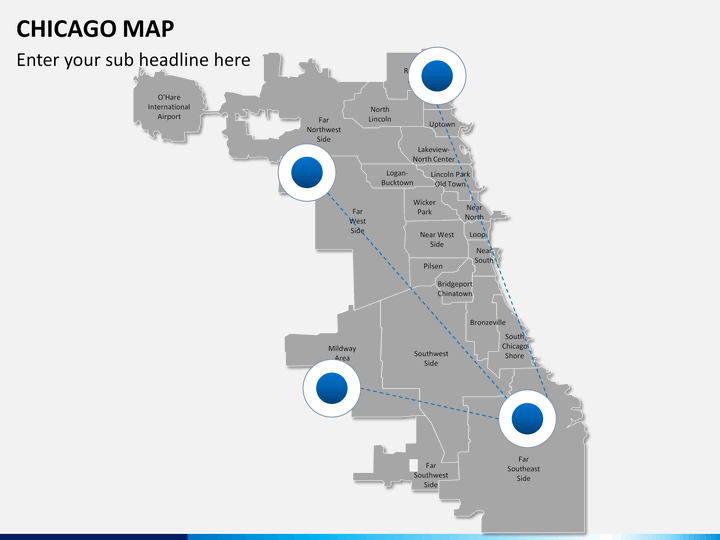
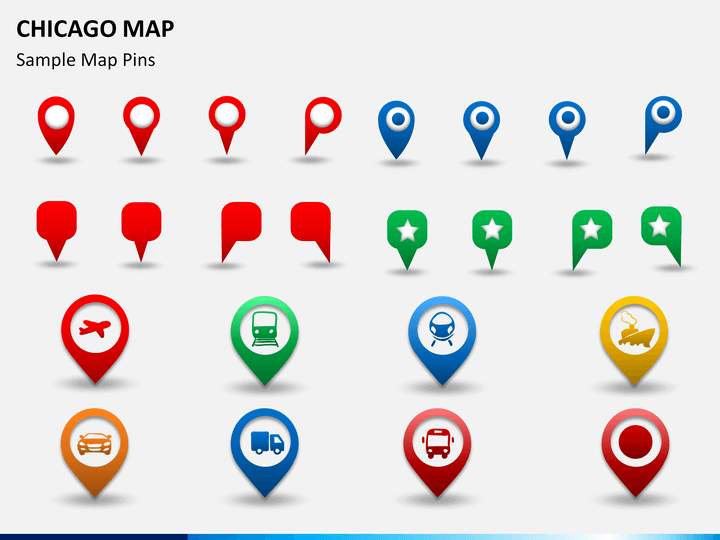
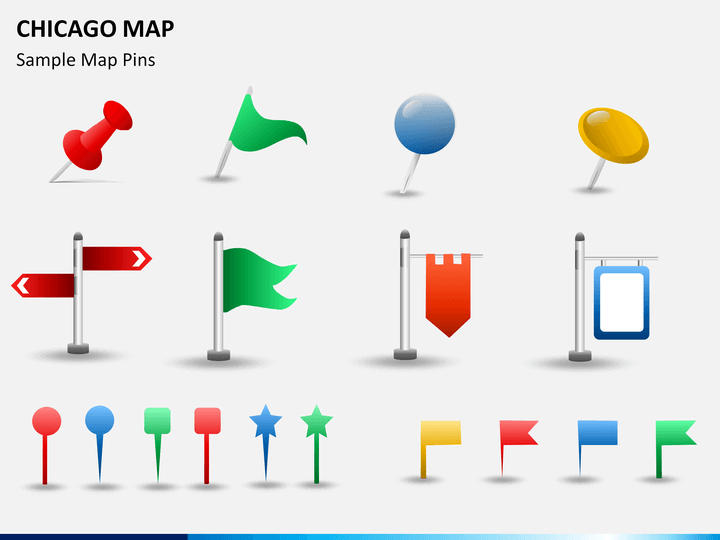
Besides having a comprehensive collection of maps, the template set also has various pins and icons as well. It can be used to further customize your slides. Simply clip any illustration of your choice and include it in your slideshows. Save your time and efforts while drafting a visually appealing presentation by using these high-definition maps. An entirely editable set, it can be personalized in seconds without any knowledge of designing.
Write Your Own Review

Related Products


