


Similar Products
- Sale

-
- Sale
- Sale
- Sale
- Sale


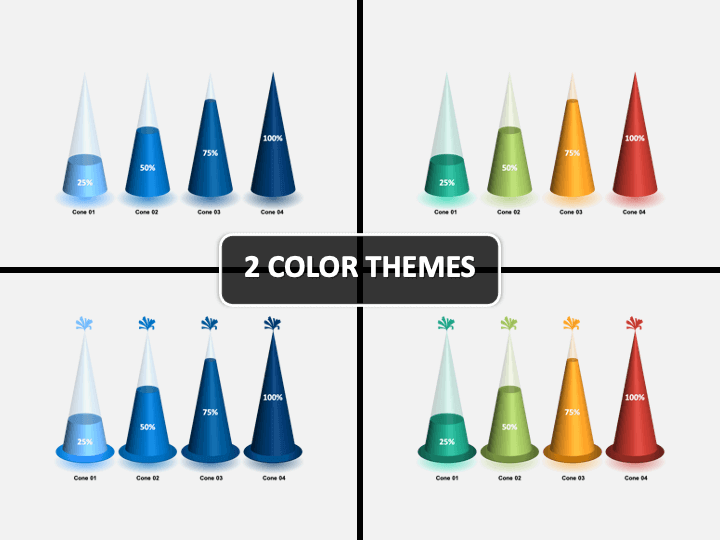
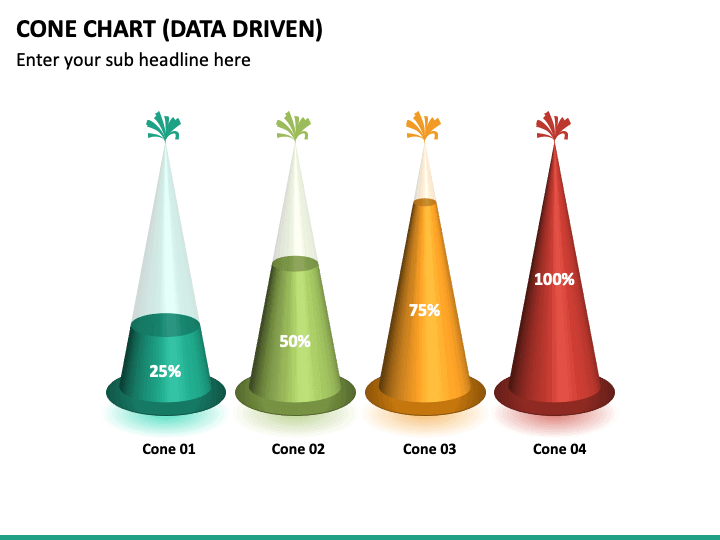
Download the Data Driven Cone Chart PPT and use the slides to give a better visual appearance to your presentations related to sales & marketing, manufacturing, logistics, and HR. You can showcase concepts like staff availability, production rate, lead generation over a time period, facts & figures, effective strategies, features comparison, on-going discounts on various products & services, etc. The cone diagrams are filled with random values to give them a 3D look. Their usage will make it easier for you to explain the & the audience to grasp the information.
Know the Designs Well
The precisely crafted layouts will let you put your innovative ideas easily. Take a sneak peek at them.
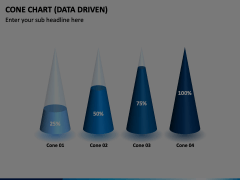
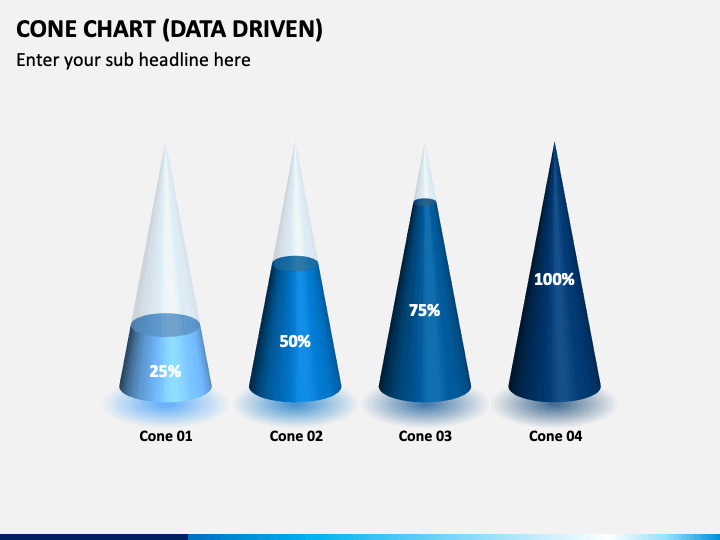
- One of them consists of a set of four cones arranged sequentially to represent 25%, 50%, 75%, and 100% of data, respectively.
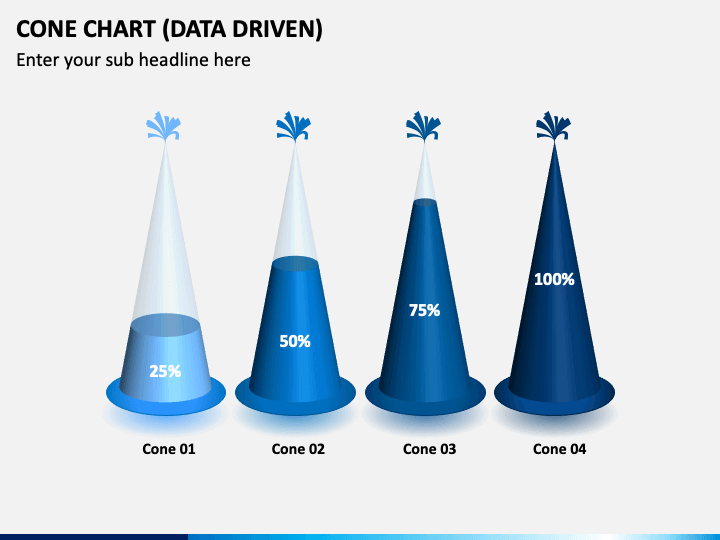
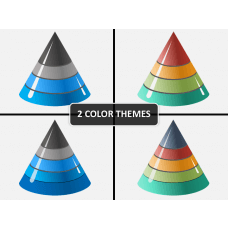
- Another one showcases the data through four creatively crafted birthday cap-shaped designs.
- The next layout demonstrates the instructions to change the data’s value in an existing PowerPoint chart.
Pick any of them and present your information in a well-organized manner.
A Glance at the Impeccable Features
- The moment you download the PPT, you will get its ownership for a lifetime.
- As per the presentation’s needs, you can customize the infographics entirely, even if you don’t have any editing skills.
- Nothing will affect their resolution as the graphics used are high-definition.
- They are made from scratch to give your slideshow an authentic look.
- To provide you the needful assistance, we have an all-time availability of customer support executives.
Download the slides and impress your audience with the visuals!
Write Your Own Review

Related Products


