


Similar Products
- Sale

- Sale
- Sale
- Sale
- Sale
- Sale


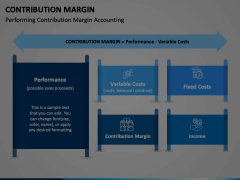
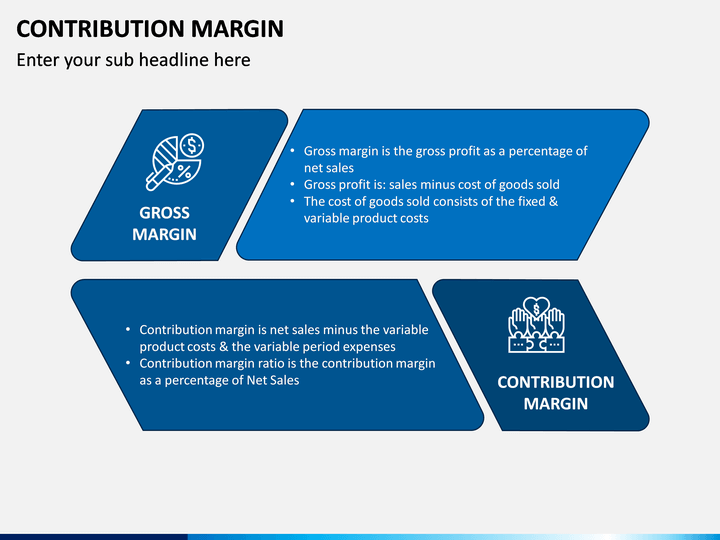
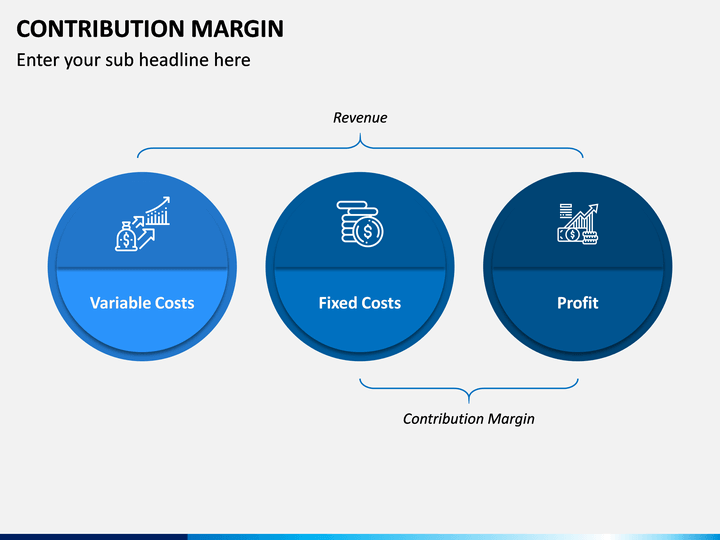
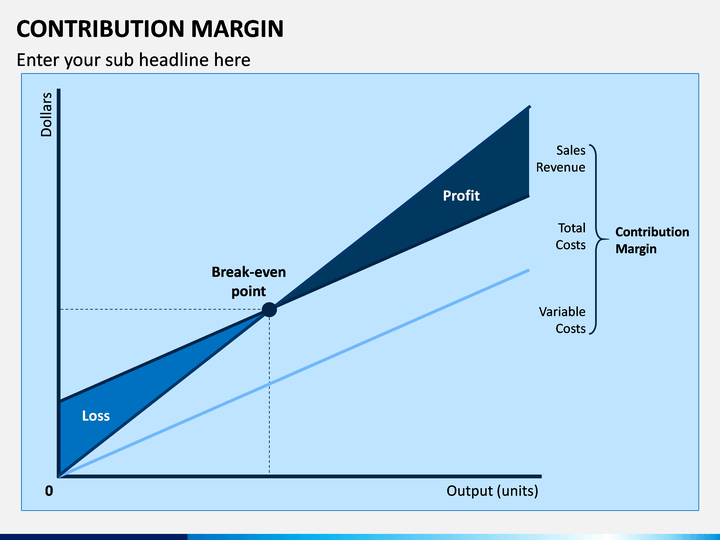
Subtracting the variable costs from the total revenue results in increasing profit value, which is known as the Contribution Margin. In short, the portion of total sales excluding variable costs.
The revenue generated from any product is the sum of all: fixed cost, variable cost, and profit. On the other hand, the Contribution Margin (CM) consists of profit and fixed costs only. Nowadays, this concept is necessary to understand not only for the sales and marketing team of an organization but also for the students studying business management. So, either you’re a sales manager, financial advisor, or an educator, discussing its important concept with a mass audience can be a difficult task. A presentation would be the most suitable and easiest way for it. Don’t worry; you need not put unnecessary effort preparing one from scratch; instead, download our Contribution Margin PPT template and deliver an impeccable presentation.
Stunning Visuals and Compelling Content
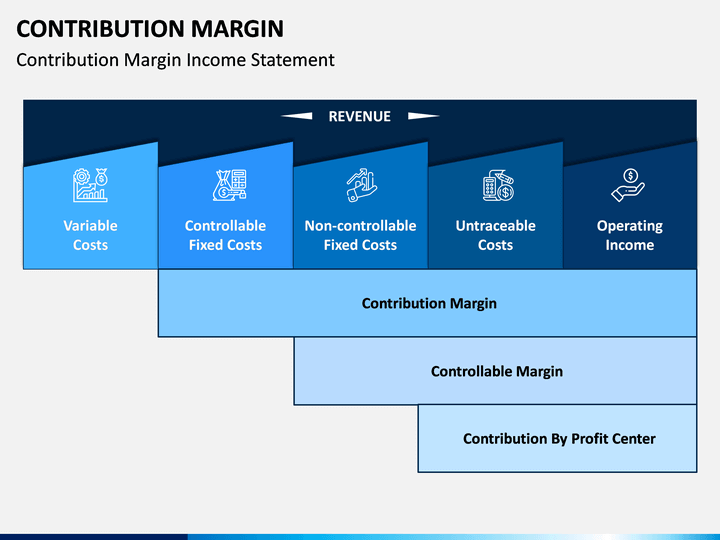
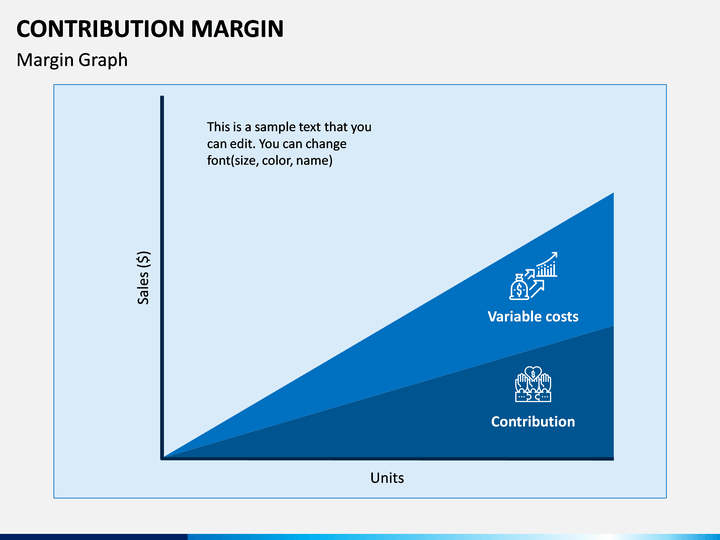
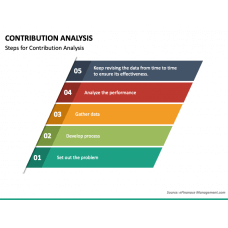
We ensure that you will get stunning visuals and relevant content on this subject in our template, which are prepared by our proficient research and designing team. We have used high-quality infographics, icons, and charts to make the content self-explanatory. Our designers have designed them using PowerPoint objects to ensure their optical quality remains top-notch. You can explain the contribution margin amount or ratio, income statement, performing CM accounting, the difference between contribution and gross margin, etc. You can pick and use any slides from the PPT.
Can be Easily Customized
If you want to add or remove any element or text from the PowerPoint template, you can do that very comfortably. There is enough space to add your own text. You can even customize the font type, size, color, and format. Scaling, resizing, and removing graphical elements is possible to adjust them with the screen size. The resolution will remain intact as they are HD and vector-based. All can be done without any prior designing skills. Amazing, right? Get it today!
Deliver with Confidence
- Separate compatible files for various platforms, i.e. Microsoft PowerPoint, Google Slides, and Apple Keynote
- To make it more versatile, we have made it in two different aspect ratios (4:3 and 16:9) so that you can access it on the standard screen as well as widescreen.
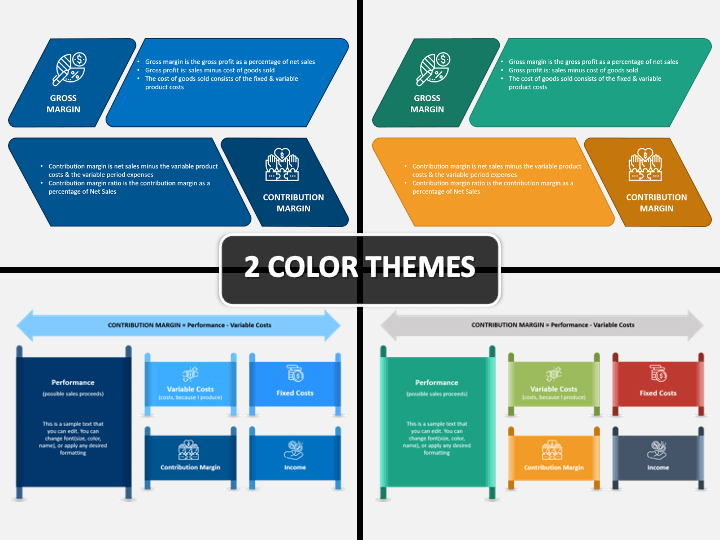
- The template is made in two different color layouts; blue and multi-color
Write Your Own Review

Related Products


