
Cylinder Bar Chart (Data Driven) for PowerPoint
(11 Editable Slides)


Cylinder Bar Chart (Data Driven) for PowerPoint

SB906
Available For


Similar Products
- Sale

-
- Sale


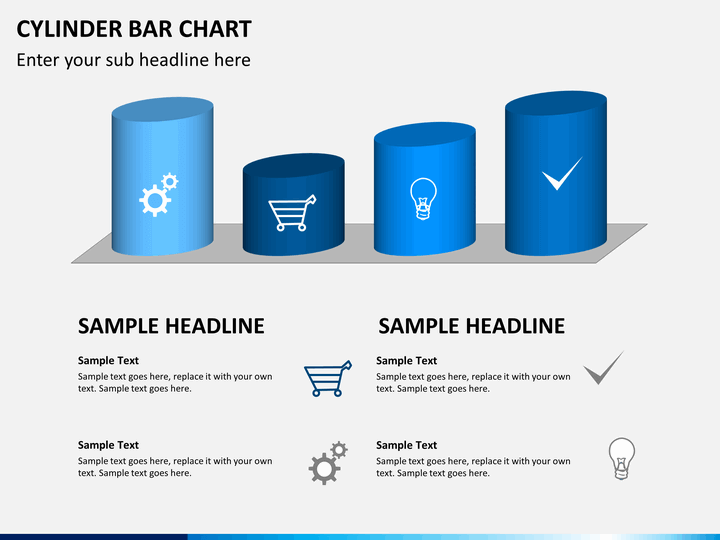
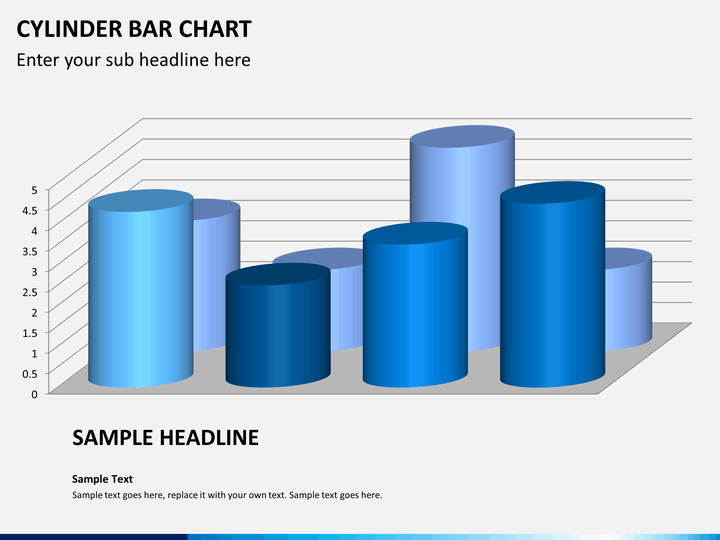
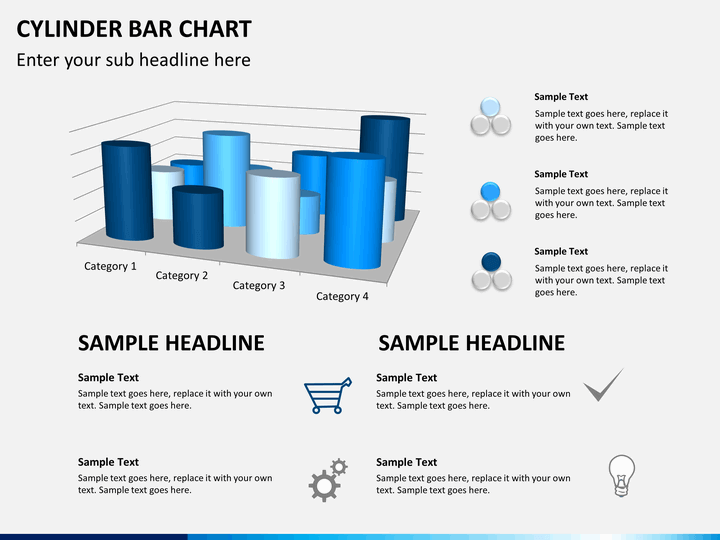
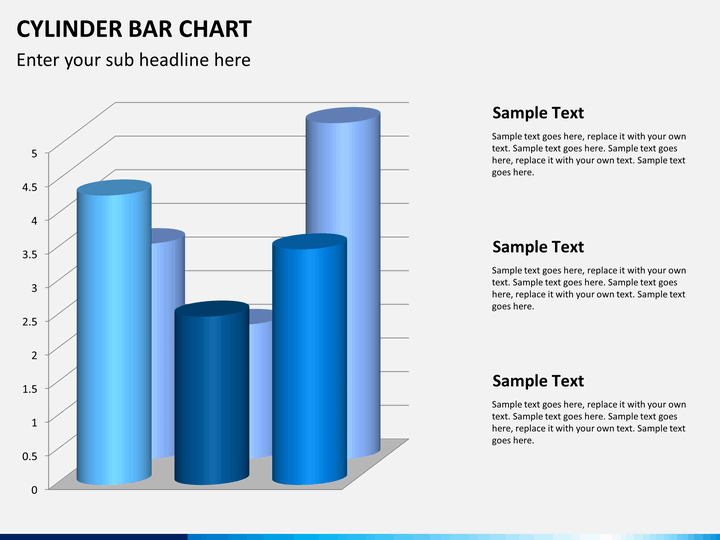
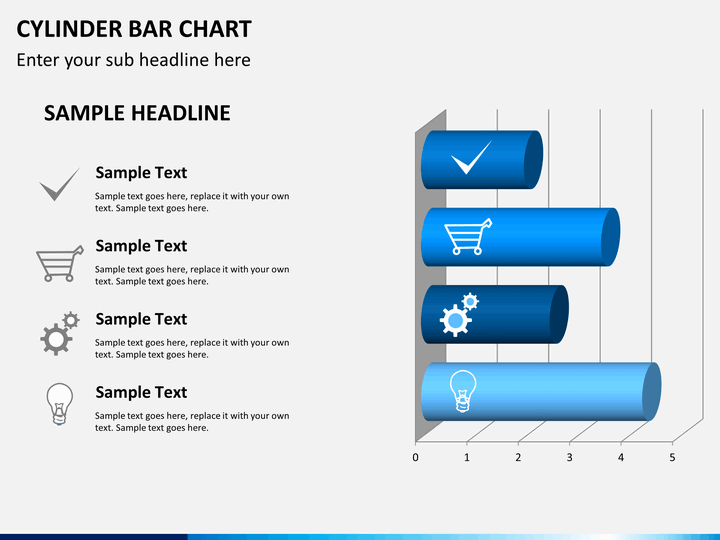
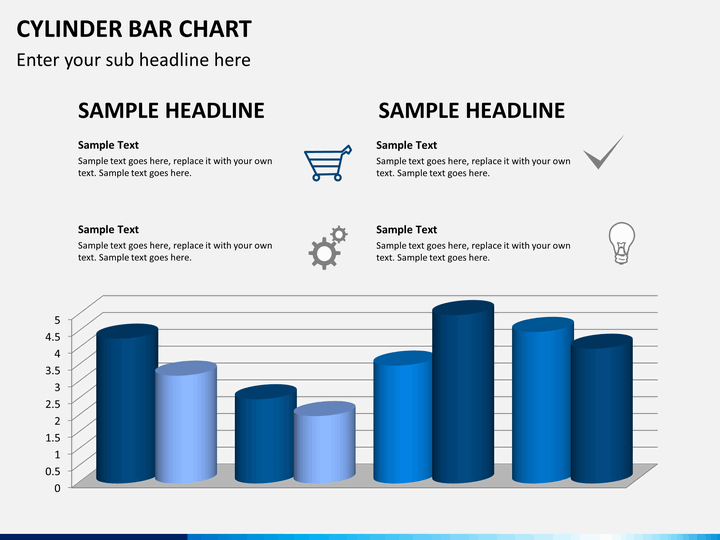
We have brought you the creatively designed Cylinder Bar Chart PPT template to help you showcase categorical data in a captivating manner. Senior executives can use the slides to represent the company's sales figures, profitability, and revenue over a period of time. Business developers can leverage the stunning bar chart illustrations to present their market share in different countries. Sales experts can showcase the demand of their different product offerings, highlighting the increase or decrease compared with the previous year's data. HR managers can also capitalize on these cylinder chart infographics for illustrating the contribution of different teams and departments in the successful accomplishment of a specific task/project.
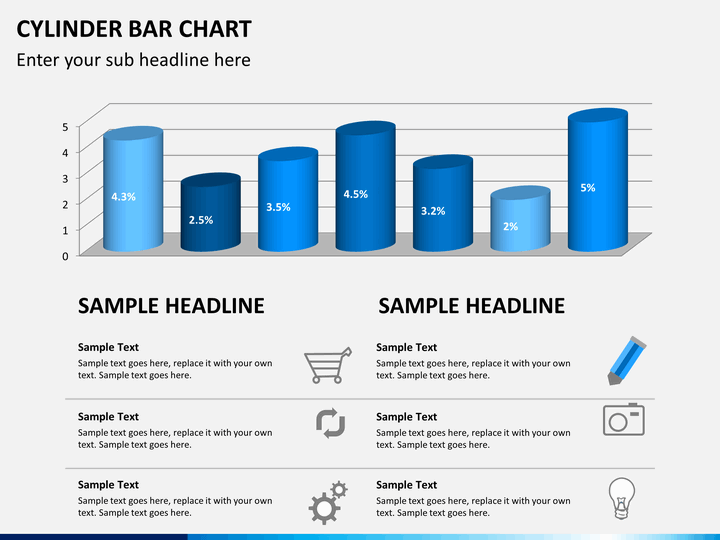
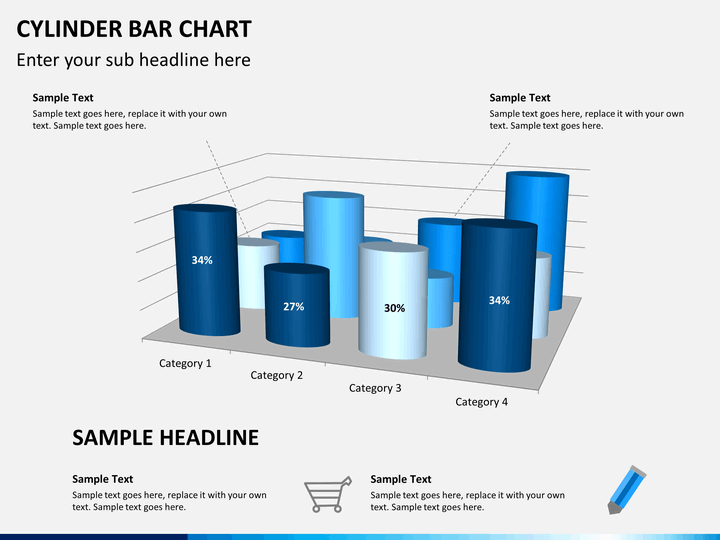
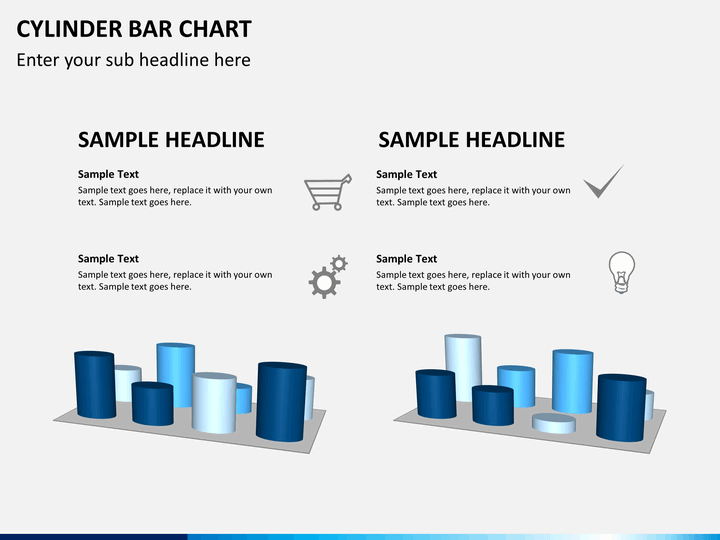
Picture-Perfect Slides
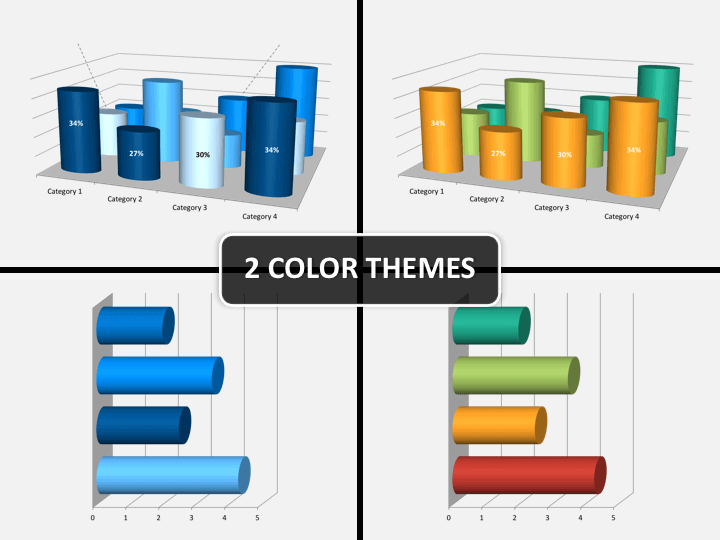
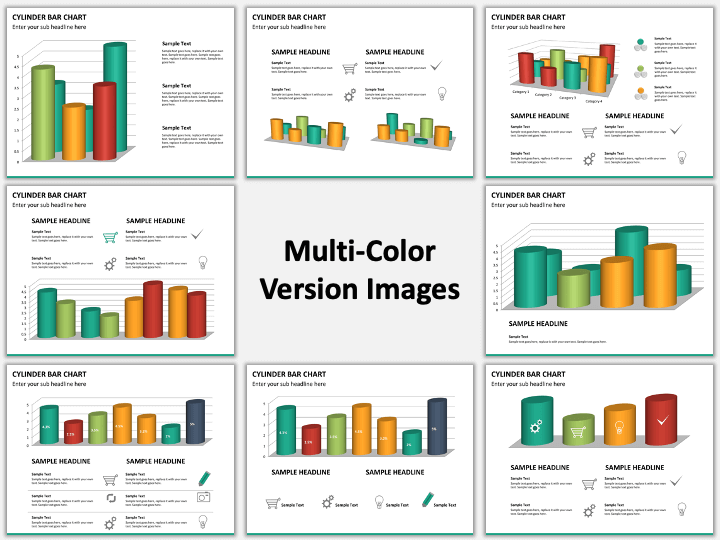
The set comprises various vertical and horizontal cylinder bar illustrations. These are adorned with stunning color combinations and sophisticated background themes. You can use them to accentuate the text and enhance the visual appeal of your presentations.
Key Features
- You can make the desired changes in no time and without investing much time or effort.
- The eye-pleasing illustrations assure the optimum resolution on all screen sizes.
- Our designers have crafted the set after thorough research, leaving no room for copyright infringement issues.
- Our 24*7 available customer support executives will promptly address all your concerns and queries.
So, download this exquisite PowerPoint template now!
Write Your Own Review

Related Products


