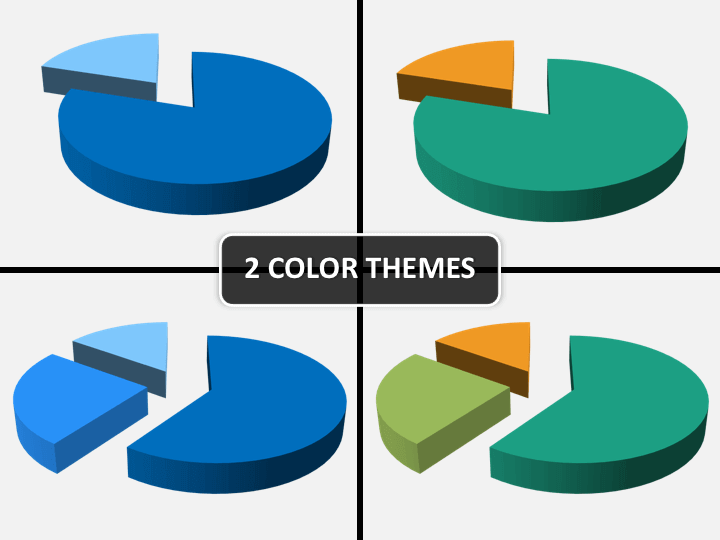
Dismountable Pie Chart (Data Driven) for PowerPoint
(10 Editable Slides)
Dismountable Pie Chart (Data Driven) for PowerPoint
Available For
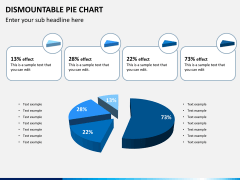
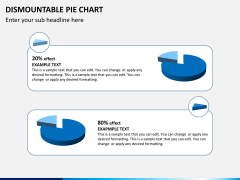
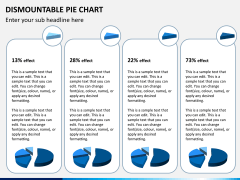
Analysts, researchers, and business leaders can use our Dismountable Pie Chart PPT template to depict the data of various research and analysis in a visually impressive manner. You can leverage these captivating pie chart infographics to illustrate the percentage of profits from different business units and countries, revenue from different products, types of customers, and much more. Market research analysts can leverage these graphics to portray their findings on the potential markets, including the market share of competitors and the percentage-wise impact of factors on customer behavior.
Advertising and marketing professionals can capitalize on the pie chart illustration for providing information on the proportion of reach of different promotional mediums in the specific region. Government officers can showcase the portion of male, female, children, and older people in the total population of a city/state/country.
Eye-pleasing Slides’ Design
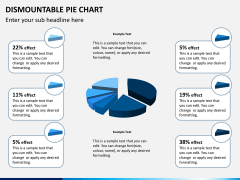
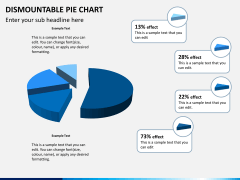
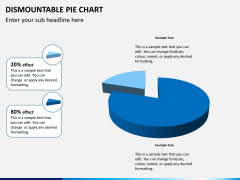
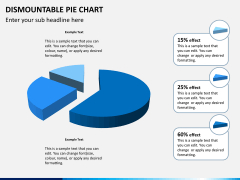
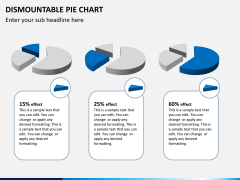
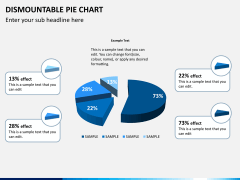
The PowerPoint slides contain various dismountable pie chart graphics with sufficient space for text insertion. You can make the best of these illustrations by infusing them into your existing or future presentations to uplift their visual appeal.
Features
- All visual elements offer fuss-free editing; hence, the users can conveniently align them to suit their needs.
- The illustrations are crafted with a high resolution to make sure they look the same, even when presented on a widescreen.
- The deck is crafted carefully, leaving no room for copyright violation issues.
Download the PPT right away and give a creative makeover to your lackluster presentations!

