


Similar Products
- Sale

- Sale
- Sale
- Sale
- Sale
- Sale


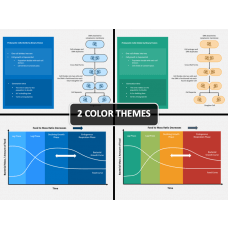
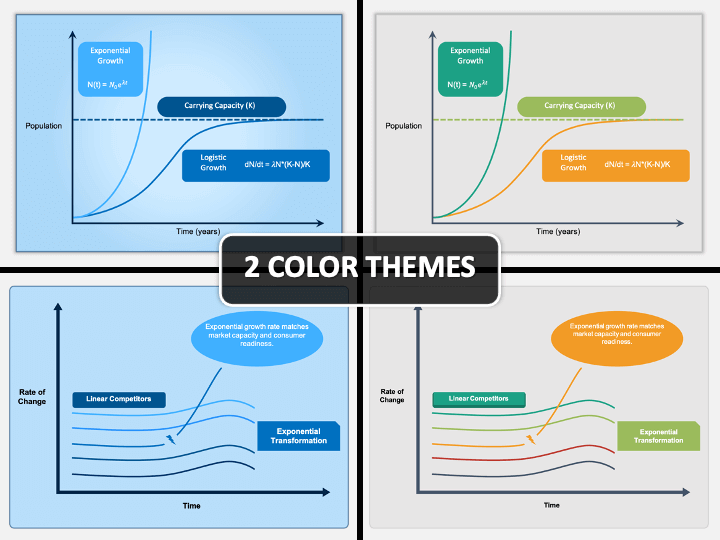
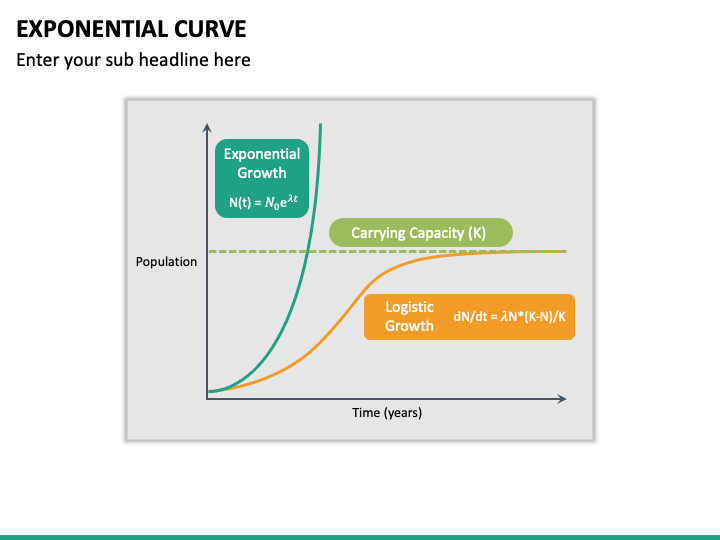
Explain the increase in compound returns, population, market readiness, etc., over time through graphical representation using our pre-designed Exponential Curve PPT template. Business professionals, analysts, and educators can make most of this set to educate their audience about how the rate of a quantity changes with time. You can also explain the formula for calculating the growth rate.
Thoroughly Prepared Deck
Accentuate your presentation with the slides embedded in the PPT.
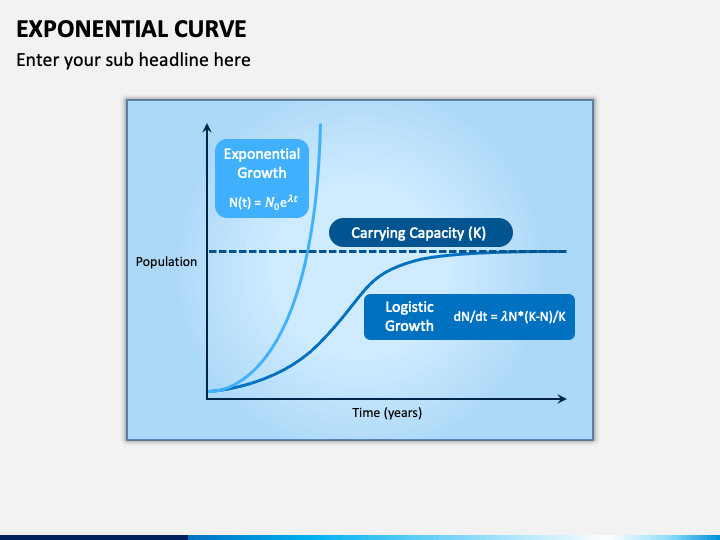
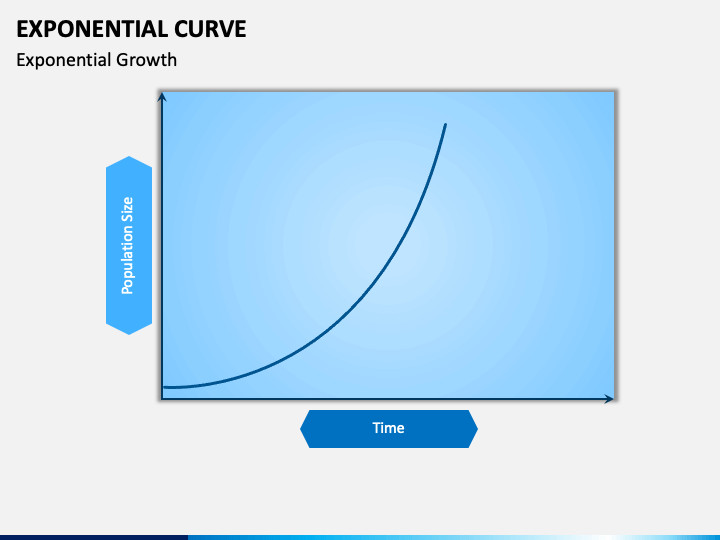
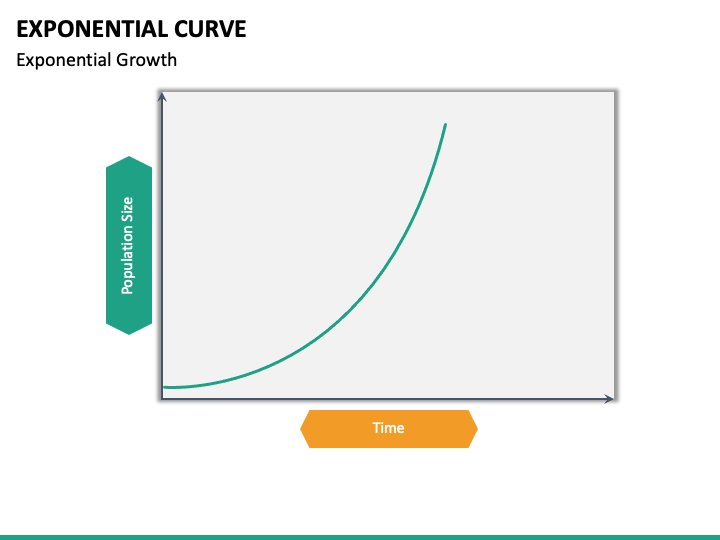
- The increase in population with respect to time is showcased through a graph.
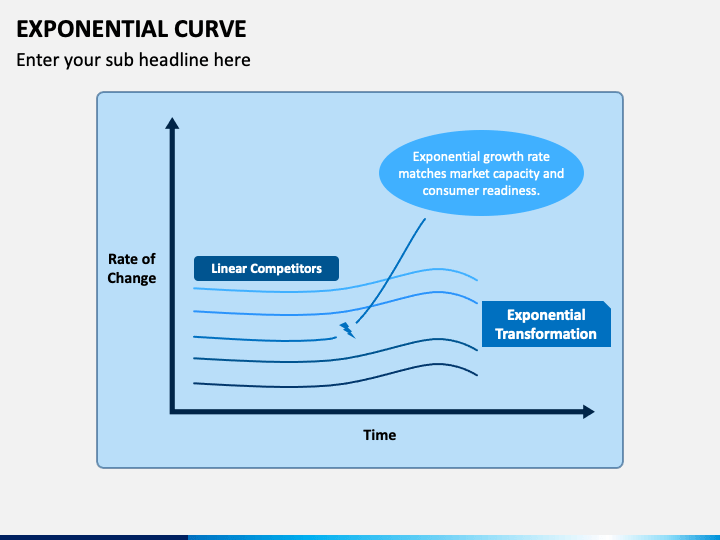
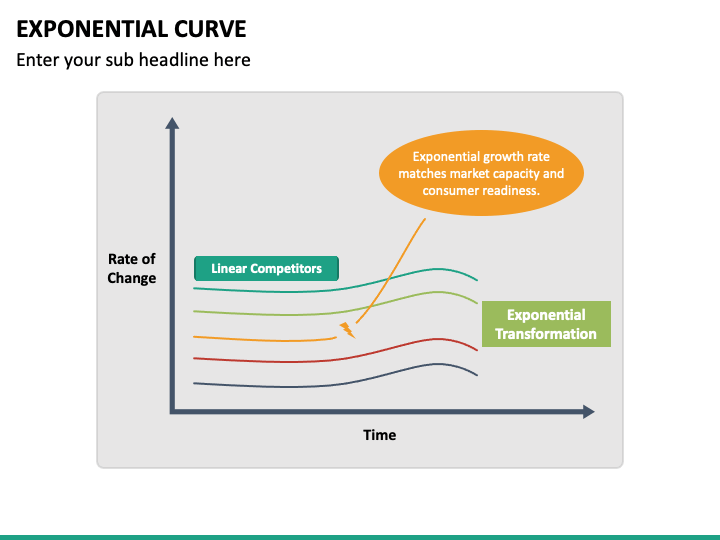
- The exponential transformation has been depicted through a graph representing the time on the X-axis and the rate of change on the Y-axis.
- A simple 2D exponential graph with the x and y-axis representing time & population size, respectively, is portrayed in the last slide.
Features
- All the designs are original to keep copyright issues at bay.
- They are made up of high-definition graphics to ensure their intact resolution.
- They are editable to let you mold them the way you want without any prior editing knowledge.
- The deck comes with lifetime ownership.
- At any moment, you can ask for help from our well-trained customer support team.
Download the template and make your boring presentation lively!
Write Your Own Review

Related Products


