


Similar Products


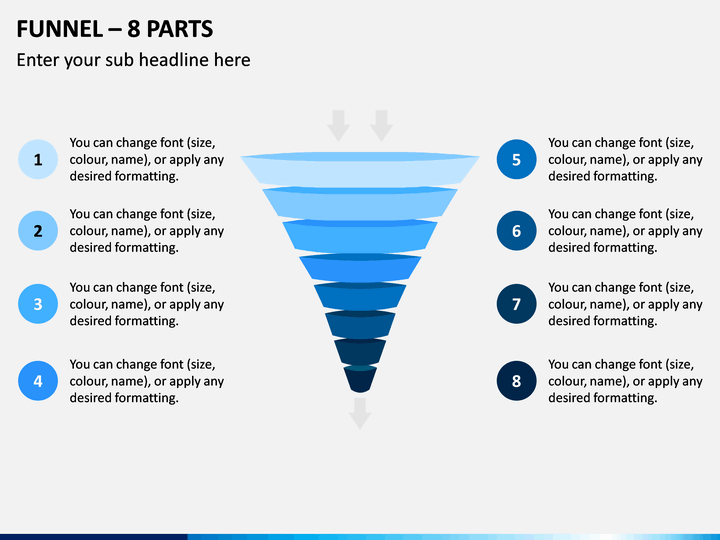
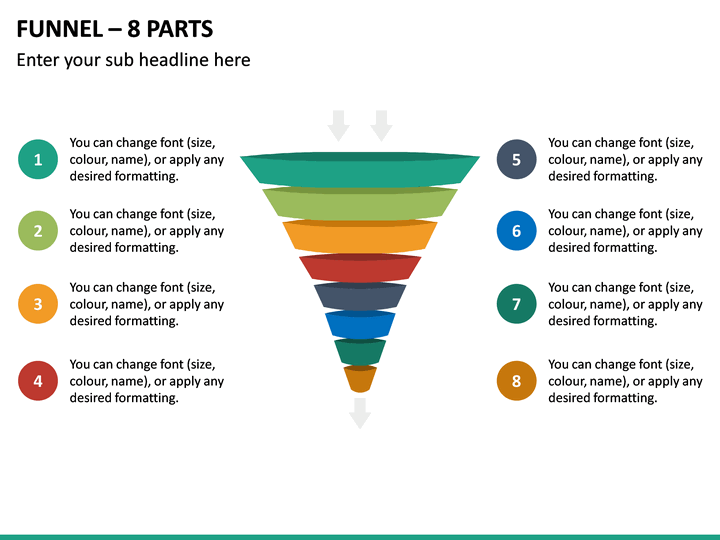
Download our 100% editable Funnel – 8 Parts PPT to display a large volume of information in easily digestible snippets with less text. The slide contains a high-definition funnel infographic segmented into eight parts. Using it, data scientists can visualize the eight steps in the data life cycle. Business professionals can leverage the illustration to throw light on the eight phases involved in the purchasing decision and stepwise process for product development. You can also capitalize on this eye-pleasing visual to illustrate Kotter’s 8-step model of change, levels of maturity, and a lot more.
The infographic is adorned with stunning color combinations and unique shading effects. It can be used to add meaning to your text and visual appeal to your presentations.
Stunning Features
- The illustration can be resized and recolored without technical skills or external aid.
- Each attribute has been designed after thorough research, leaving no room for copyright infringement issues.
- No restrictions on the number of uses after downloading the PPT only once.
Make room for this impeccable PowerPoint slide!
Write Your Own Review

Related Products


