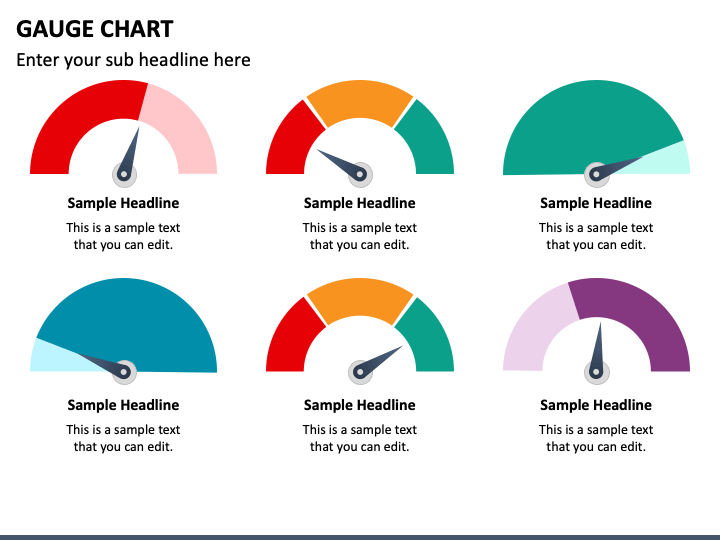
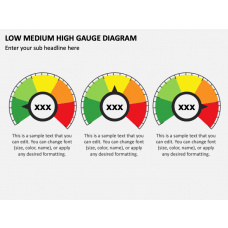
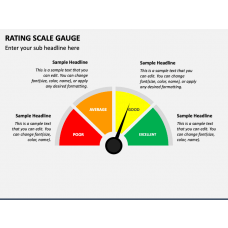
Get your hands on our Gauge Chart PPT to represent the visual tool designed to show the progress of a project, goal, or objective. Business leaders can use these illustrations to present the advancement of employees towards the set goals. Marketing and sales managers can use this PowerPoint slide to depict the sales targets and competitive analysis. Moreover, professionals from various industries, such as healthcare, academics, finance, and economics, can use this gauge chart to showcase key indicators.
The PPT portrays various speedometers in striking color combinations to enhance the visual appeal of your presentations. The classy background encourages your viewers to concentrate on your content. So, download it now to impress the audience!
Distinct Features
- You can customize this slide effortlessly without external assistance or technical support.
- The high-definition visual graphics ensure impeccable resolution and quality on large screens.
- Every element and vector has been crafted after in-depth research to prevent copyright issues.
Download this unique PPT right away without thinking twice!

