
Leading Vs Lagging Indicators PowerPoint and Google Slides Template
(15 Editable Slides)


Leading Vs Lagging Indicators PowerPoint and Google Slides Template

SB1729
Available For


Similar Products
- Sale

- Sale
-
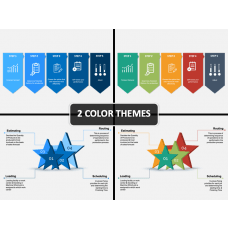

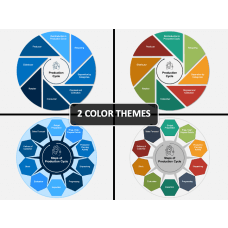
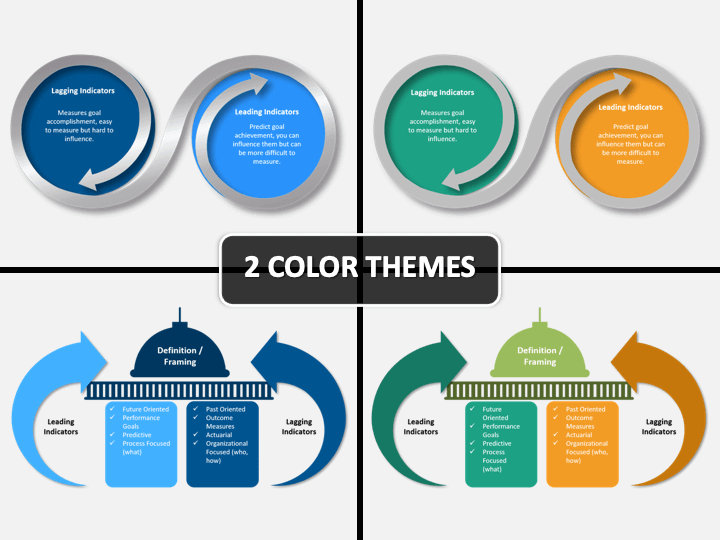
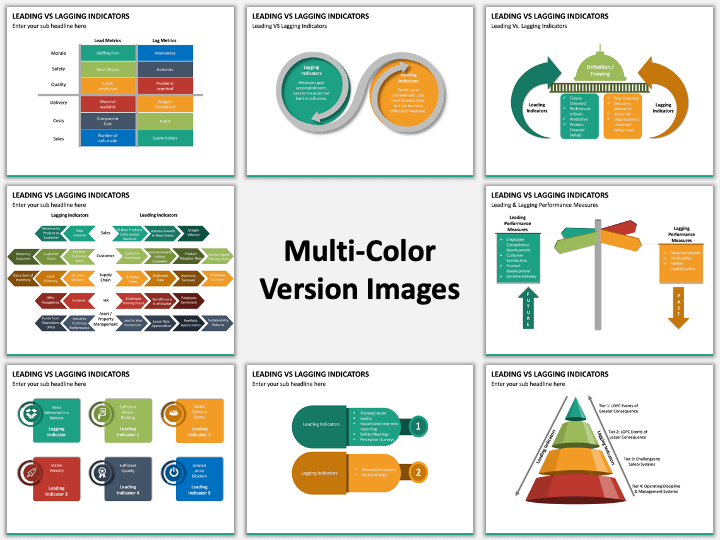
Leading and lagging indicators are tools to measure and manage an organization’s performance. A balanced combination of both eventually results in improved performance. At times, it can be a bit tricky to understand and distinguish between the two. Our 100% customizable Leading vs. Lagging indicators PPT slides are here to help you out and offer solutions to your company’s growth. The set describes how firms of all sizes use these indicators and what they make of it. The PPT can be downloaded instantly from our website in two amazing color schemes. It can be displayed on both Apple Keynote, and Google Slides as well.
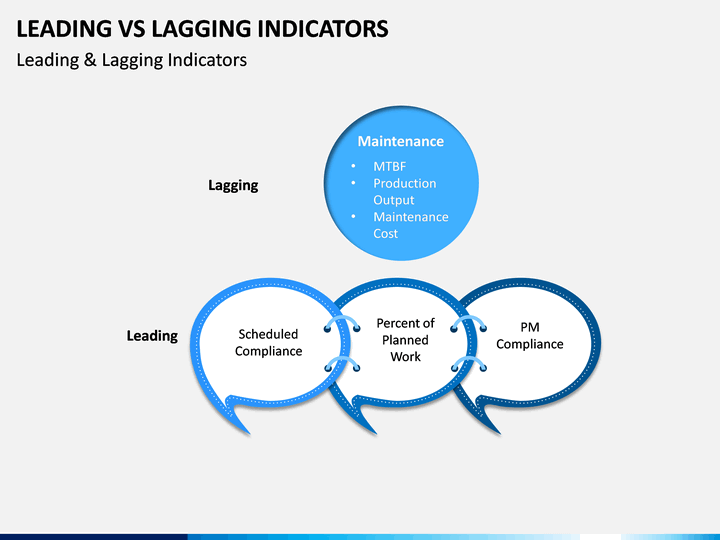
What are they exactly?
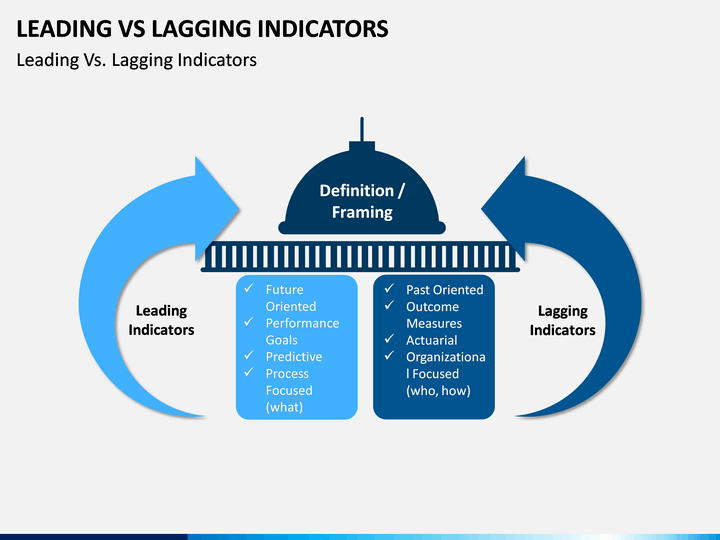
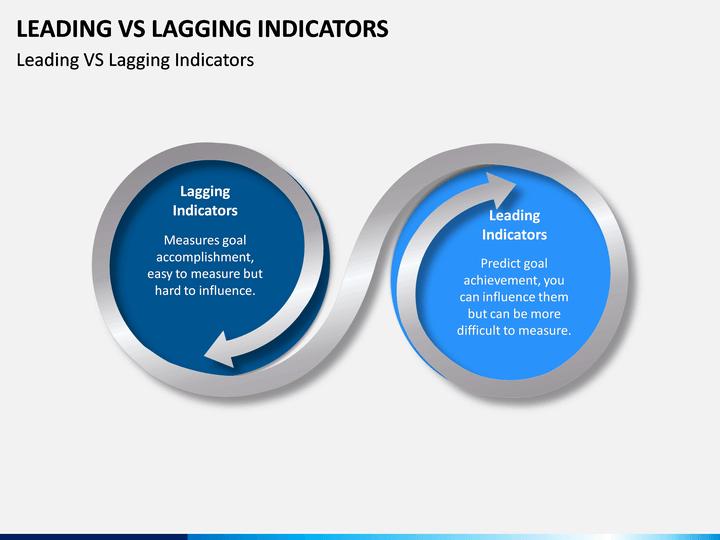
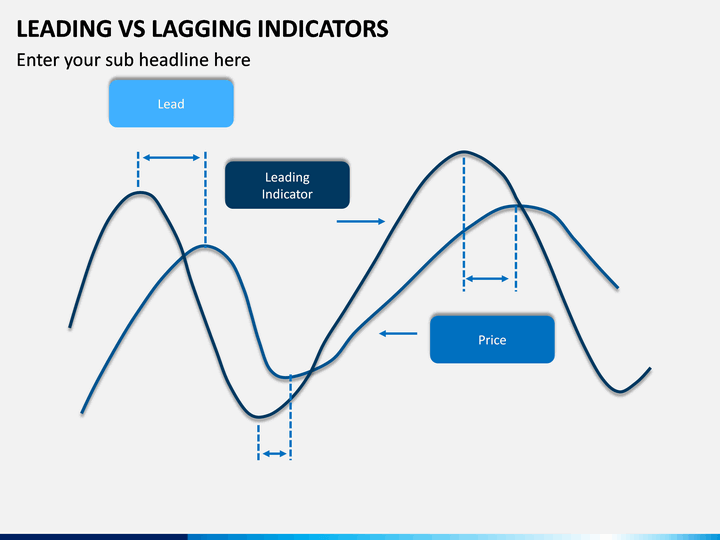
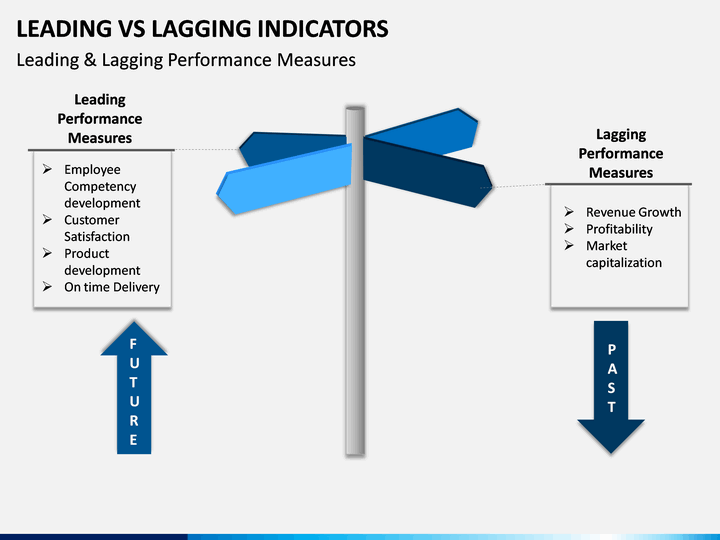
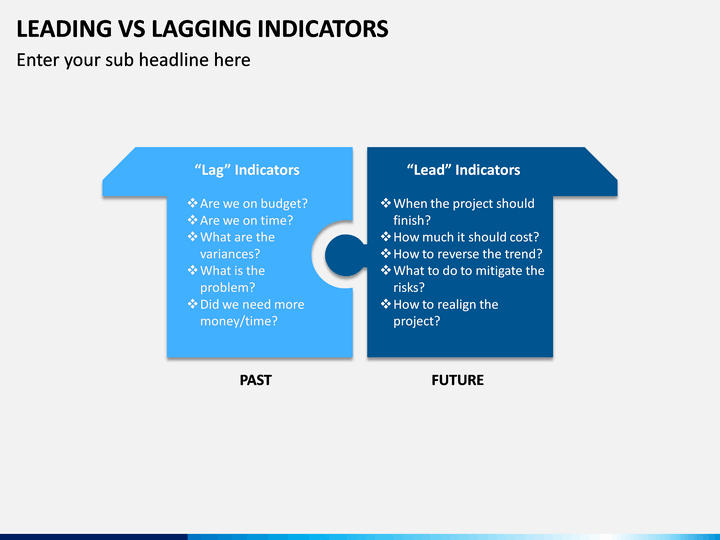
Simply put, a leading indicator measures the current performance to predict outcomes and events. Whereas a lagging indicator measures past performance to study achievements or losses till now. Leading vs. Lagging Indicators PowerPoint template conveys to your audience the full definition of these indicators. It also explains the key differences with examples. Sometimes an indicator can be both lagging and leading. For example, if you have hired the right people for a job in a given time in the past, and that worked out well, it becomes a lag indicator. But it also becomes a lead indicator as in future hiring the right people will boost the company’s performance. With such simplified slideshow learning, you can offer more to your team than ever before.
Customize as much as you like
You can make an unforgettable presentational experience by using the remarkable features of this layout. The layout’s high-definition graphics are all vector-based by our team of professional designers. So without any drop in the visual quality, you can easily resize, reshape, recolor, move or remove any of the icons and objects. With similar creative liberty, you can add to or edit any of the provided textual information to suit your slideshow needs. As a presenter, sometimes you have to keep in mind the duration of the next session or a different approach to address your class or a team. In such cases, you can make adjustments in the slides with elementary PowerPoint skills.
Why wait?
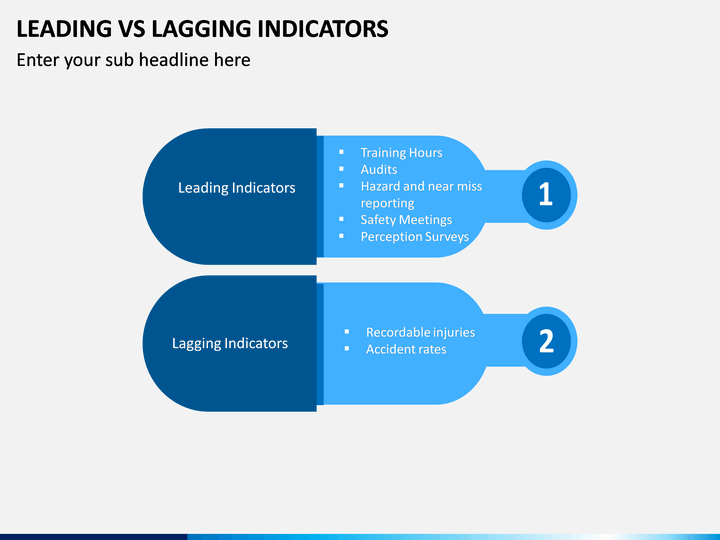
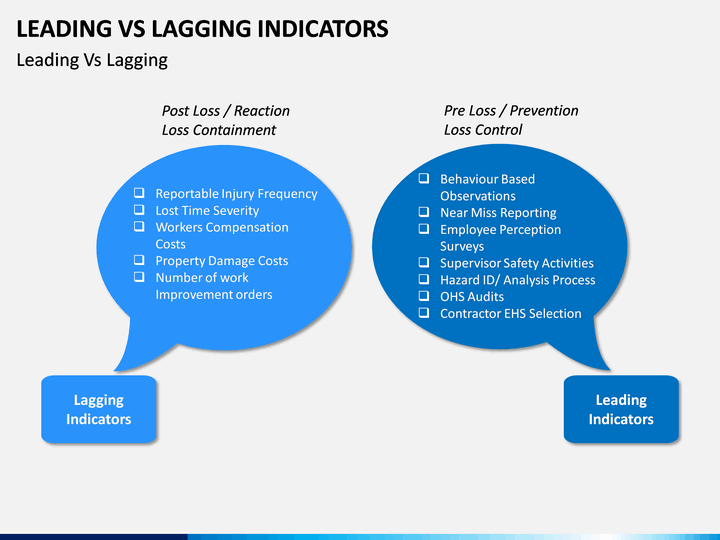
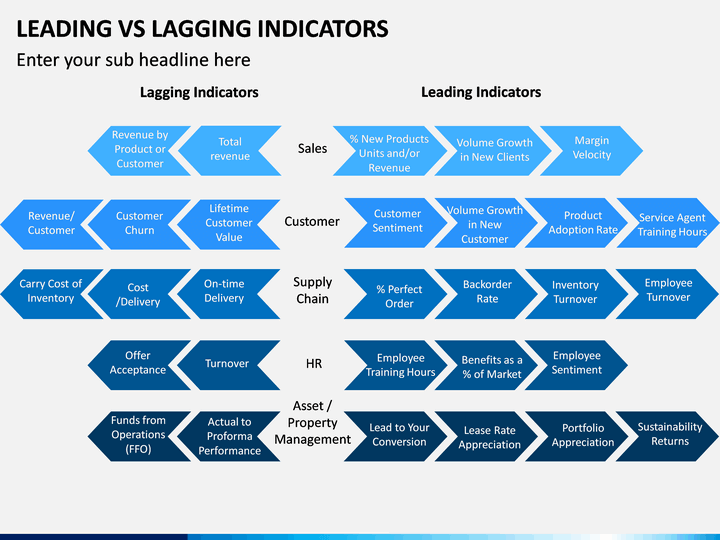
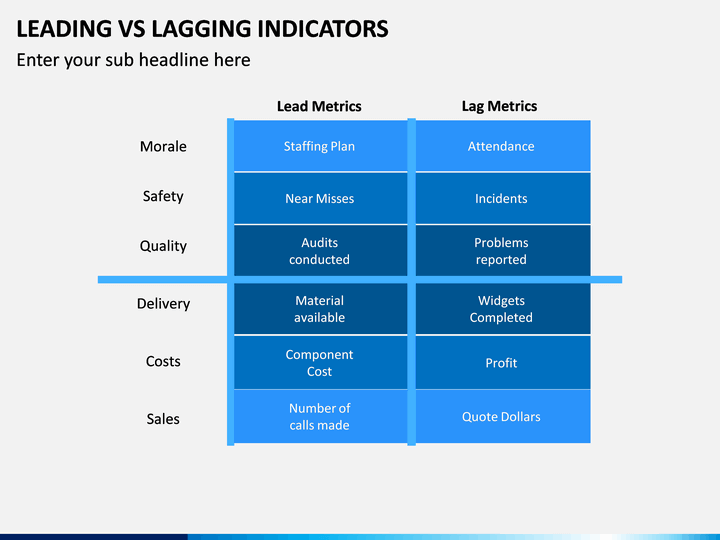
The set of slides will prove the most useful for product manufacturers, service providers, customer relationship executives, CEOs, COOs, marketing and sales agents, strategy planners, etc. The PPT provides examples of metrics in sales, supply chain, HR, property management, etc. It offers pointers on loss prevention and control and pointers on company progress. And there’s a lot more for conceptual understanding and solid utilization of indicators for growth. So what are you waiting for?
Write Your Own Review

Related Products


