


Similar Products
- Sale

- Sale
- Sale
- Sale
- Sale
- Sale


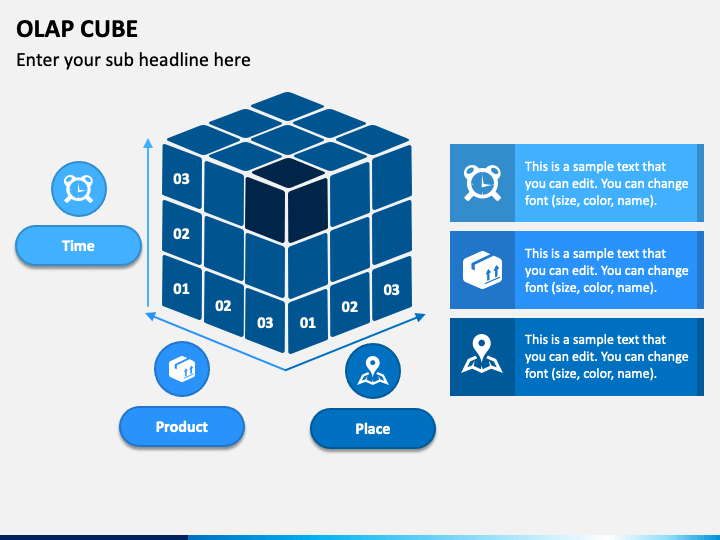
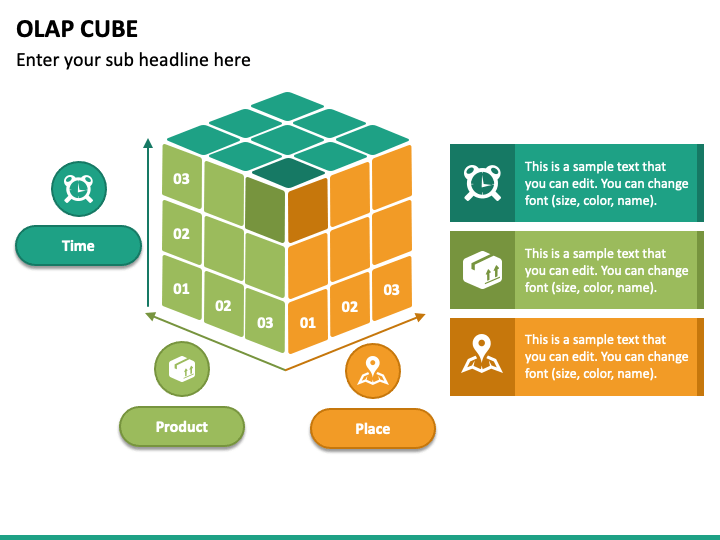
Download the OLAP Cube PPT and showcase how this data structure can be helpful in doing a quick analysis of data from multiple databases to get useful insights. You can visualize how senior leaders like CFO, Project managers, production heads, and many others can make the most of this diagram to beautifully present major business issues: time, product, and place. Besides organizational issues, you can display financial data, actual and budget expenses comparison, multidimensional dataset, etc., using it. To provide a detailed explanation to the audience, you can talk about what kind of data it is suitable for, its analytical operations, the advantages, and practical tips for using it.
Steal the Show
The infographic available here is crafted with a perfect pinch of creativity & professionalism. It features:
- A cubic-shaped structure made up of several square boxes.
- The three dimensions clearly illustrate three aspects, i.e., time, product, and place.
- For easy comprehension, each aspect is presented using a relevant icon.
- Text placeholders are there to let you add required content in the desired format.
Features
- You can leverage the benefits of the PPT for your entire life by downloading it only once.
- The PowerPoint slide is made from scratch to keep them free from copyright issues.
- It is entirely editable without any prior editing skills or external support.
- There will be no loss to the resolution even after several changes as the graphics used are high-definition.
- Our well-trained customer support team is available 24*7 at your service.
Download the slide now, and in a world full of boring presentations, let yours shine!
Write Your Own Review

Related Products


