
P-F Curve for PowerPoint and Google Slides
(12 Editable Slides)


P-F Curve for PowerPoint and Google Slides

SB2024
Available For


Similar Products
- Sale

-
- Sale


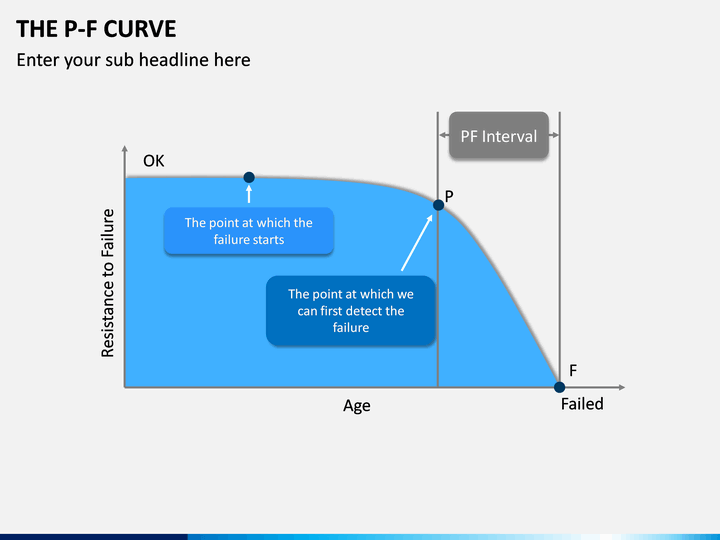
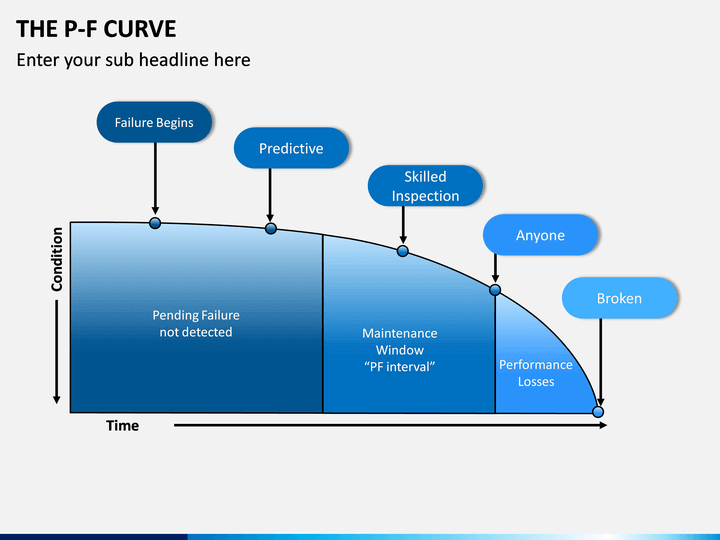
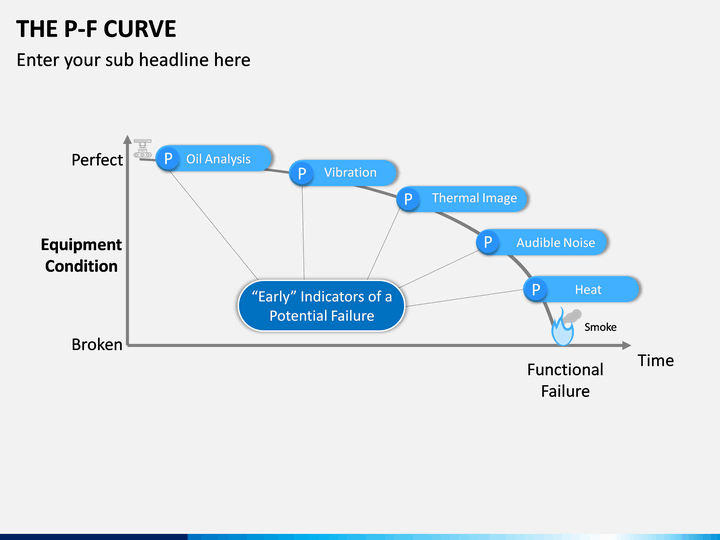
Also known as the Predictive Failure or Potential Failure curve, it is a well-structured graph that helps us understand the failure cycle of a device, system, or equipment over time. By predicting when a system is going to fail, we can take proactive measures and minimize the damage of the failure. The curve was first introduced to discuss the water retention cycle (soil water shortage) but has gradually moved to several other verticals.
Since there can be different kinds of predictive curves, it is essential to understand them first. You can take the assistance of this informative P-F Curve PowerPoint template to discuss the topic and teach others about it in detail.
Draft informative slideshows like a pro
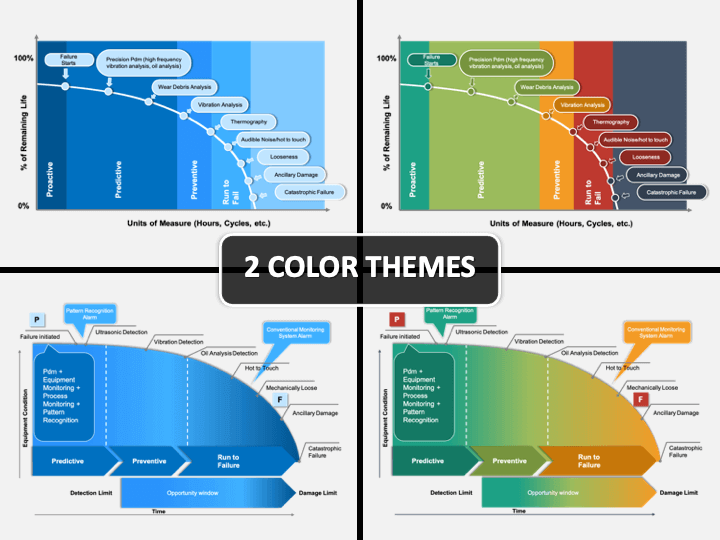
If you wish to come up with an engaging as well as an informative slideshow on the topic, then you should certainly download this P-F Curve PPT presentation template. As you can see, it features a wide range of graphics exploring the topic in detail. There are readily available graphs that are designed by professionals after extensive research. You can use them as it is or make the relevant changes to further customize them.
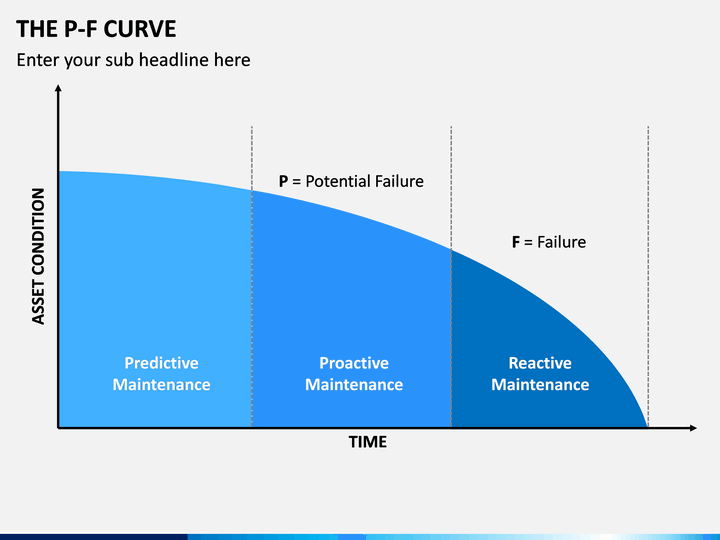
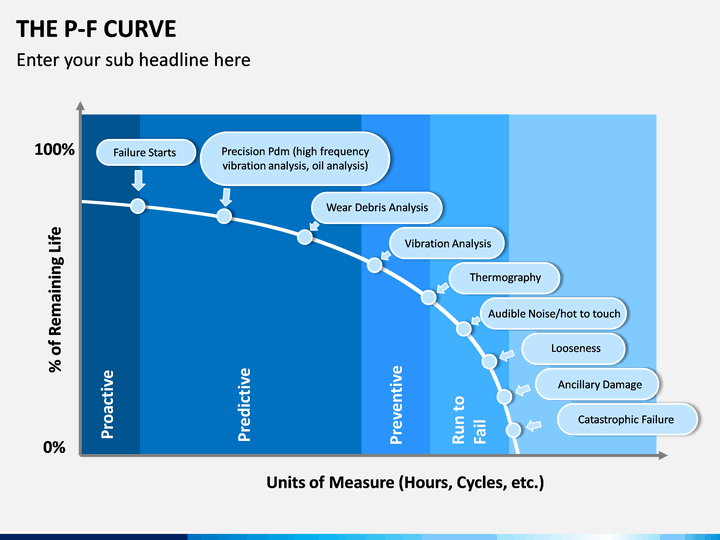
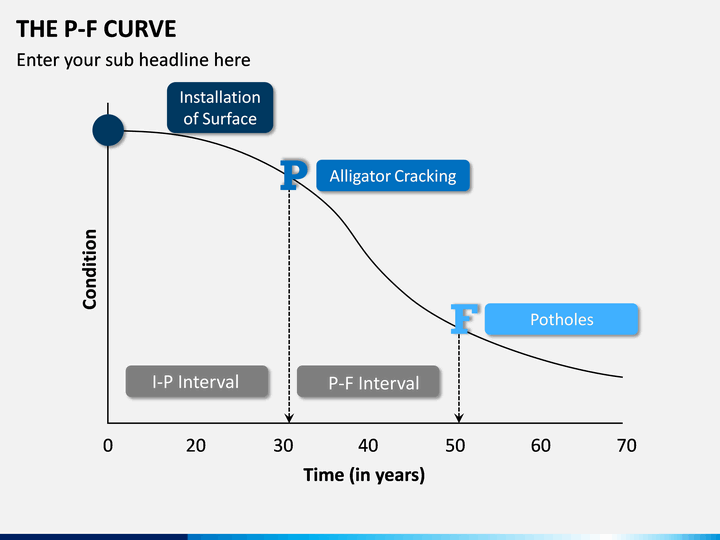
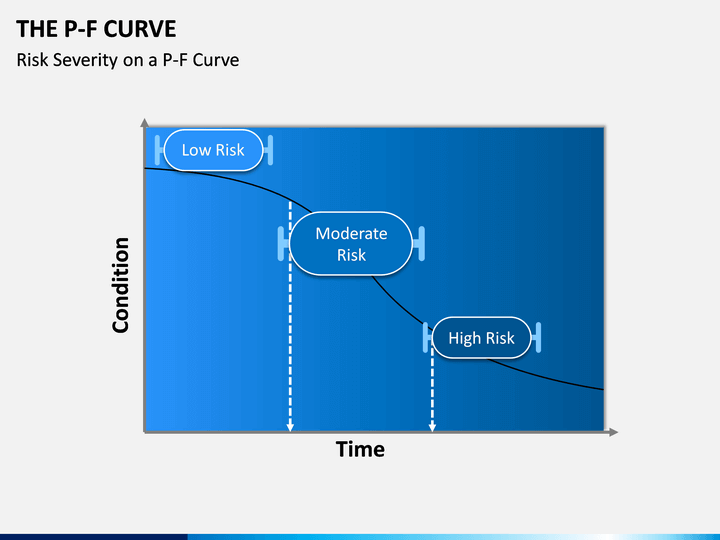
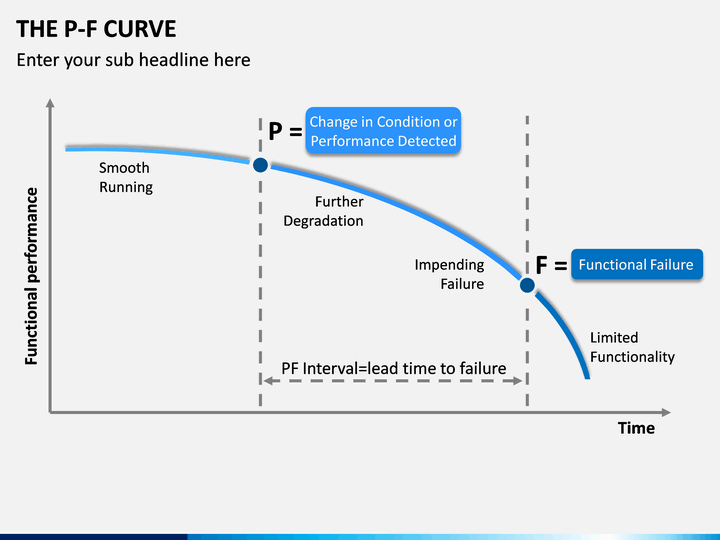
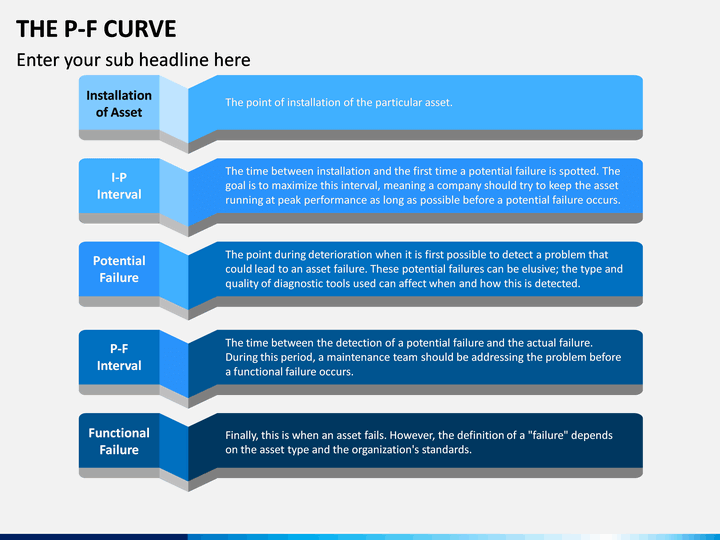
With these graphics, you can teach your audience how to calculate the age of any equipment and the way the curve is made. You can also focus on different stages, like predictive, proactive, and reactive maintenance. There are all sorts of parameters that are included in these graphics like usage time, functional failure, equipment condition, functional performance, and so on.
Visually appealing and engaging
Since a concept like a predictive failure curve can be a bit complicated, you need the best visual aids to explain the topic to your audience. You will undoubtedly find the right illustrations in this set. It consists of basic as well as advanced graphics that you can use as per your requirements. Since these vectors can be used with Microsoft PowerPoint, Apple Keynote, and Google Slide, you would not face any compatibility issue.
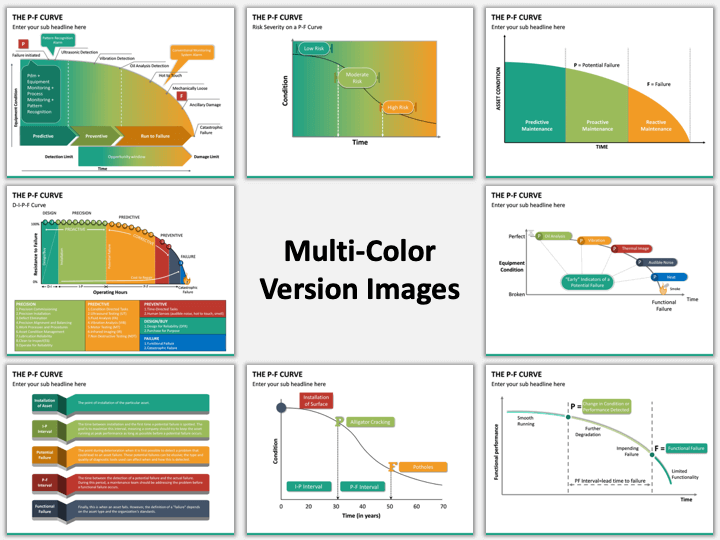
Are you looking for more features? Apart from being so user-friendly, the set also comes in different color themes. This means you can select a theme of your choice and further save your time in editing.
Write Your Own Review

Related Products


