


Similar Products
-

-
-
-
- Sale
- Sale


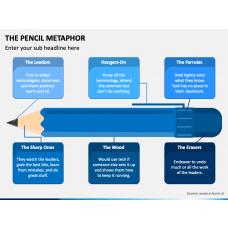
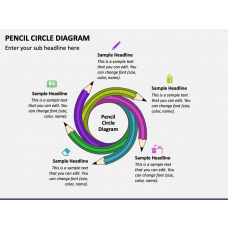
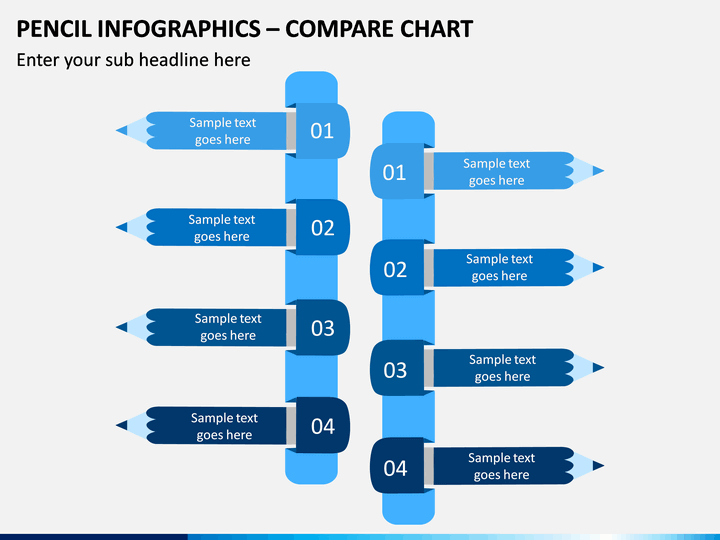
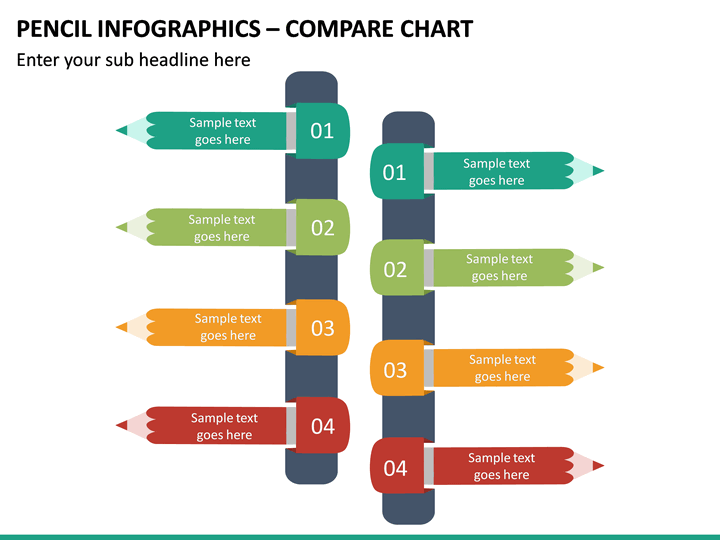
Make elegant and professional presentations in minutes using our pre-made Pencil Infographics - Compare Chart PPT. Sales experts can leverage this 100% editable PowerPoint slide to compare the sales performance over the years and features of their products or services with those of competitors. Business leaders can compare the outcome of multiple strategies, differences between two concepts, positive and negative aspects, actual and desired results, etc.
The PPT portrays pencil infographics pointing in different directions. The captivating graphics will let you easily depict the complex data to your audience. The vibrant colors will keep the viewers hooked till the end of your slideshows. Steal the limelight by downloading this beautiful slide today!
Splendid Features
- The high-definition objects ensure the best quality and resolution on a large screen.
- A team of skilled customer support executives is available 24*7 to resolve your doubts at the earliest.
- You can customize every element effortlessly without editing skills or technical assistance.
- The visuals have been created after thorough research to refrain from copyright breaches.
Download this wonderful PPT right away!
Write Your Own Review

Related Products


