Performance Meter PowerPoint and Google Slides Template
(5 Editable Slides)
Performance Meter PowerPoint and Google Slides Template
Available For
-
-
-
Key Performance Indicator (KPI) PowerPoint and Google Slides Template
(14 Editable Slides)
-
-
-
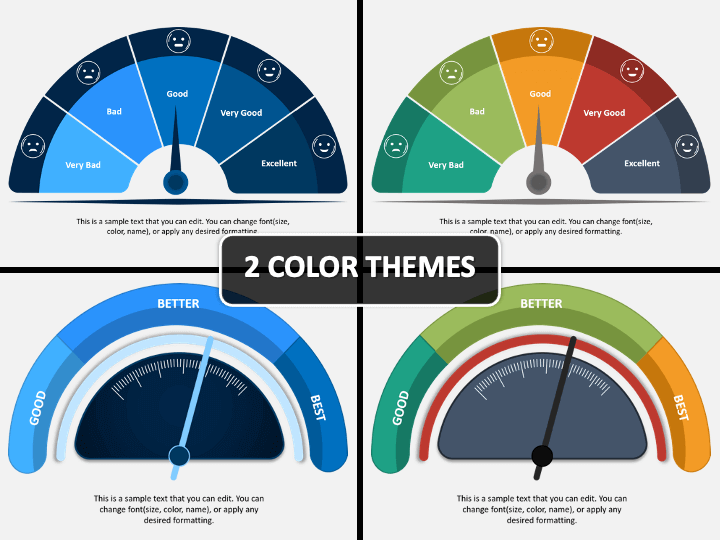
Illustrate the productivity and efficiency of your employees with attention-grabbing visuals using the Performance Meter PowerPoint template. This completely editable deck is designed very professionally, incorporating high-quality graphics and stunning color combinations. Each segment of the meter is highlighted using different colors to make them distinguished.
From scaling the graphics to adding the text, from recoloring the visual elements to removing the slides, everything can be done with ease, without any external support and technical expertise. So, download the set right away!
A PPT with Professionally-Designed Slides
The set includes multiple slides, each featuring a different design so that you can get plenty of options to pick the most suitable one for your presentation. Take a look at the designs of the slides below.
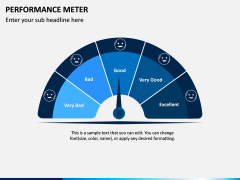
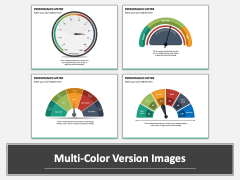
- A performance score speedometer depicting 5 metrics - Excellent, Very Good, Good, Bad, and Very Bad. All the metrics have been complemented with the icons of relevant emoticons.
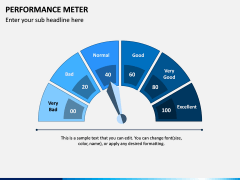
- A speedometer with 6 metrics - Excellent, Very Good, Good, Normal, Bad, and Very Bad. Each metric has been given a specific score.
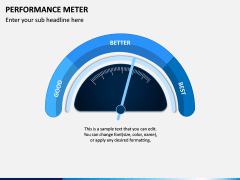
- A customizable semi-circle gauge with a meter showcasing 3 metrics - Good, Better, and Best.
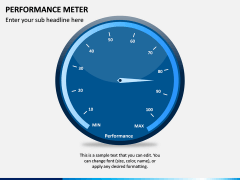
- A circular meter with a needle in the middle and 10 to 100 scores indicating the minimum and maximum performance.
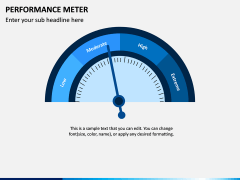
- A semi-circle gauge with a meter showcasing 4 metrics - Low, Moderate, High, and Extreme.
It is designed to captivate the audience and keep them engaged throughout the slideshow. You can customize the dial/needle of the speedometer according to your requirements. You just need to select the needle and rotate toward the desired metrics. So, download the PPT now!
Multiple Usages
Professionals belonging to different fields like business, education, medical, etc. can use the deck for various purposes.
- Demonstrate the speed of workflow and processes.
- Showcase the level of risk associated with a project or investment.
- Depict the score of employees on various parameters such as skills, quality of work, productivity, punctuality, keenness to learn, team spirit, etc.
- Represent the levels of confidence and accuracy.
- Marketing executives can use it to present the performance of their campaigns.
- Sales managers and business development managers can use it to showcase the achievement of their targets.
- Educators can use it to depict the performance evaluation of the students.
Hurry up! Download the Performance Meter PPT instantly.

