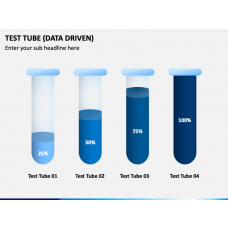
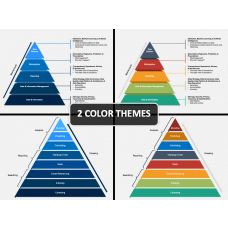
Enhance the visual appeal of your current & next business or academic presentations with the innovatively designed Data Driven Pyramid Chart PPT template. The slides embedded in it are ideal for demonstrating several concepts, like the number of satisfied clients, customer response on new features, the status of running projects, outcome of various strategies, competition in the market, website engagement, lead conversion rate, market share in different regions, etc. Educators can illustrate constituents of a chemical, participation in extracurricular activities, students’ performances over time, attendance, and many other vital information. The usage of these designs will help you present the information in a well-organized manner. So, download it with immediate effect!
Impressive Illustrations
For a striking visual appearance and easy comprehension, we have included multiple slides in the deck.
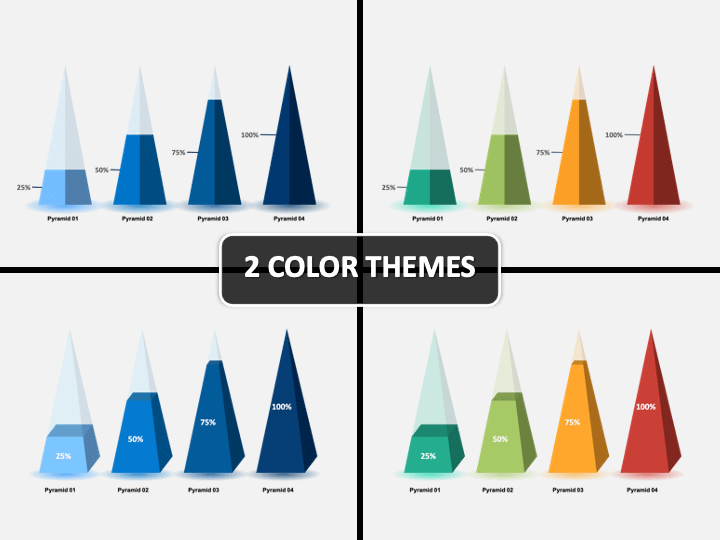
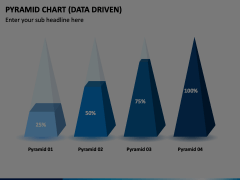
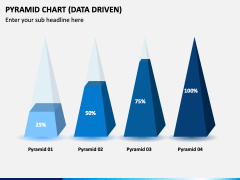
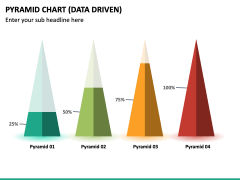
- One of the layouts represents four pyramids depicting 25%, 50%, 75%, and 100%.
- Another one features a set of four pyramids arranged on a horizontal axis with some random data filled in it.
- The next one demonstrates the complete procedure of changing the data in an existing PowerPoint chart.
Outstanding Features
- You can use the designs every time you require them, only by downloading them once.
- You can mold them the way you want, even if you don’t have any editing skills.
- They consist of high-definition graphics to ensure intact resolution on large screens.
- They are designed from scratch by a team of professional designers.
- Before or after delivering the slideshow, you can provide a handout to the viewers.
- To resolve your doubts at the earliest, we have a 24*7 available customer support team.
Download the template and impress your audience with stunning visuals!

