Use our all-new Risk Indicators PPT template to educate your audience on effectively identifying the risks and uncertainties and the right ways to deal with them in an eye-pleasing yet easy-to-understand manner. You can beautifully and comprehensively illustrate the process to develop key risk indicators. The striking designs will grab the audience’s sight right from the beginning to the slideshow’s end. Risk managing experts, product managers, senior executives, and consultants can use this professionally-crafted set to exhibit potential actions to mitigate the severity of the risk-based situations.
The deck is a combination of unique designs, self-explanatory icons, and high-definition visuals. Using it, you can add a visual appeal to it. Moreover, you can add meaning to your textual information and deliver a winning slideshow!
Key Highlights of the Deck
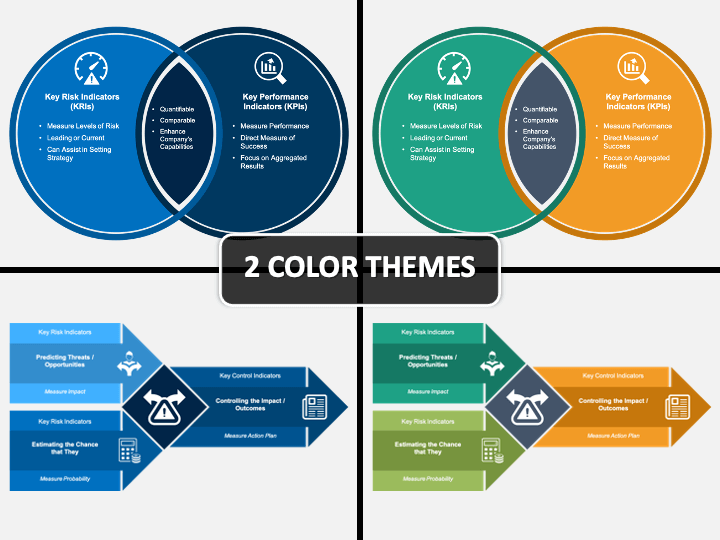
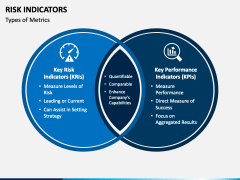
- Two interconnected circular diagrams are portrayed in the first slide. It can be used to highlight types of metrics, i.e., Key Risk Indicators (KRIs) and Key Performance Indicators (KPIs)
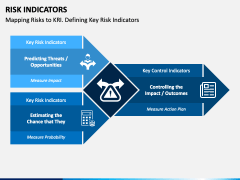
- You can portray how to map risks to KRI while defining the key indicators via a uniquely-designed illustration with appealing icons.
- Several textual boxes connected with a thin arrow line can be used to showcase a step-by-step process to develop key indicators.
- Recession risk indicators are represented in the other slide.
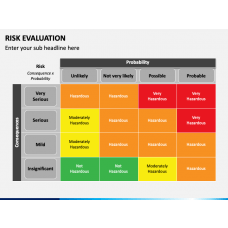
- The last slide demonstrates the severity of risks using differently colored textual boxes; green indicates low risk, and red represents an extremely risky situation.
Best-in-Class Features
- You can make the desired customizations without any technical skills or reaching out to external support.
- There are no restrictions on the number of usages.
- You can use the graphics in your existing or upcoming presentations to make them more engaging.
So, make this set yours for a lifetime by downloading it once!


