Similar Products
Use our Risk Scale PPT template to visualize the risks based on the severity and the factors causing risks. You can also illustrate the tried and tested measures to tackle the risks and minimize their negative impact. Risk management experts can use this 100% editable set to portray how to react towards risks of different levels, such as whether the specific risk should be ignored, accepted, or transferred. You can also throw light on the significance of constant monitoring processes for identifying the risks at the initial level and treating them effectively, and avoiding any sort of interruption.
Key Highlights of the PowerPoint Slides
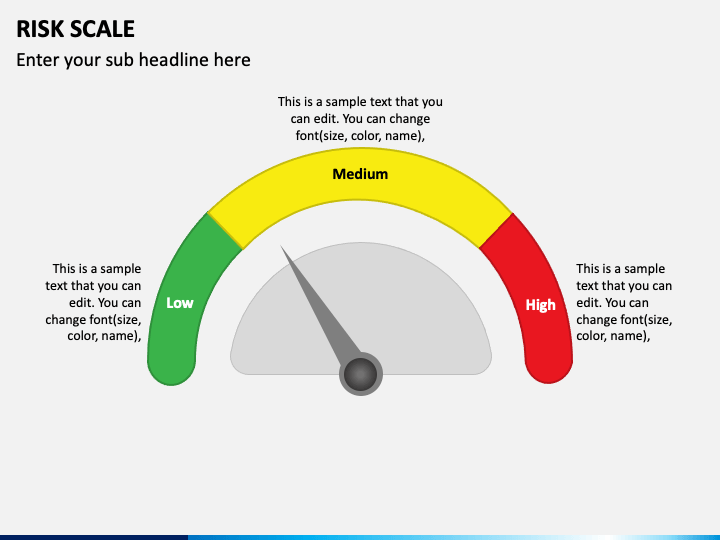
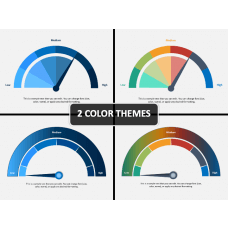
- A speedometer infographic with red, green, and yellow colors depicts the severity of risks; green indicates low risk, red describes high, and yellow means moderate risk.
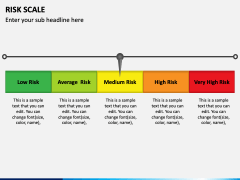
- A colorful scale illustration describes the extended version of risk severity; dark green means low risk, light green represents an average risk, yellow demonstrates moderate risk, orange illustrates high risk, and red portrays very high risk.
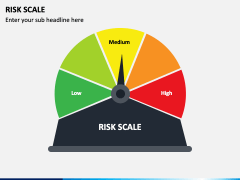
- Another beautiful and multicolored speedometer diagram can be used to describe the severity of risks.
Exclusive Features
- You can project the visuals even to large screen sizes without losing the optical resolution.
- You can make the desired modifications without investing much effort and time.
- All deck attributes are designed after extensive research; hence, no user will come across copyright issues.
So, put your hands on this PPT and deliver engaging presentations!
Write Your Own Review

