Similar Products
Download our thoroughly-researched Standard Deviation (SD) PPT template to depict how this statistical analysis method helps determine how much the value has deviated from the mean value. Educators can leverage this deck to impart knowledge on calculating the SD of grouped and ungrouped data and a random variable. Finance experts can also use this set to showcase how SD is used as a measure of the relative risk of an asset and a helpful tool in investing and trading to measure market and security volatility. The formula for calculating SD can also be demonstrated using striking slide designs.
Our designers have crafted this deck featuring impactful slides to help presenters nail their presentations.
A Quick Glance at PowerPoint Slides
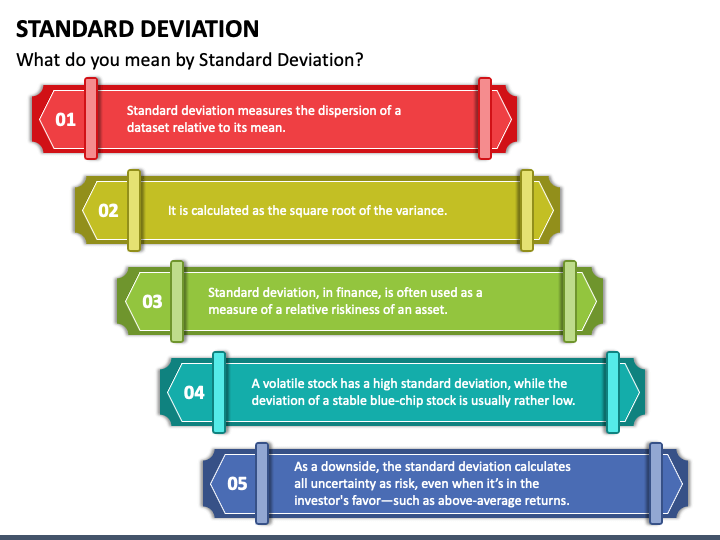
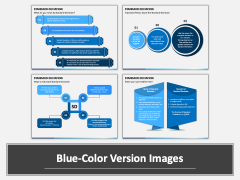
- A concise overview of SD is showcased using a few uniquely designed text placeholders.
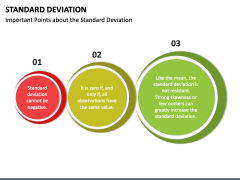
- You can depict the essential points about the SD through circular infographics.
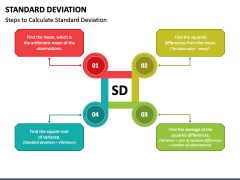
- The steps to calculate SD are presented via a creative layout.
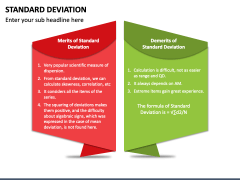
- The merits and demerits of standard deviation are represented in the other slide.
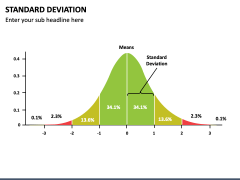
- The value of SD is illustrated through a graph illustration.
Exquisite Features
- All set attributes can be customized with the minimum time and effort invested.
- Each visual can be projected on any screen without disturbing the optical resolution.
- The users won’t encounter copyright breach incidents, as each attribute is designed from scratch.
So, download this well-designed PPT now!
Write Your Own Review

