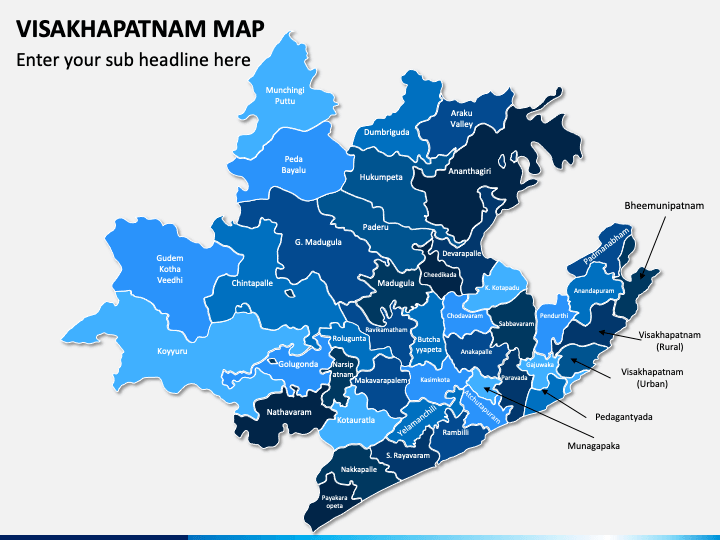
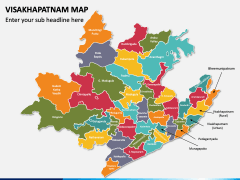
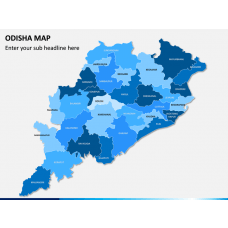
We have brought you the creatively designed Visakhapatnam Map PPT template to help you represent your business functions, marketing activities, market share, customer base, competitive position, and a lot more in Visakhapatnam. The deck comprises multipurpose map diagrams with appealing icons. You can use them according to your objectives and help your viewers grab your message instantly.
Sales and marketing professionals can leverage the set to describe their business expansion plans in the most populous city in the Indian state of Andhra Pradesh. Educators can capitalize on the map infographics for showcasing some interesting facts and information about the city, such as it is the second-largest city on the east coast of India and the fourth-largest in South India. You can further exhibit the climatic and weather conditions of the city.
A Sneak Peek at the PowerPoint Slides
- The political map diagrams of Visakhapatnam can be used to showcase all regions, districts, sub-districts, and other major attractions of the city.
- A GPS pin illustration with the flag of India adjoining a few textual boxes can be used to highlight the unknown facts and important information about the city.
- An illustration of the slide man holding the Indian flag presents the city’s demographics, history, economic conditions, and much more.
- The other slide illustrates the sample map pins with symbols of transportation modes. You can use them to point out the specific places and provide information on the available transportation facilities in the city.
- Using the icons of clouds, thunderstorms, rain, and more, you can depict the weather and climatic conditions of the city.
Enthralling Features
- Easy-to-customize
- 100% editable
- High-definition infographics
- Fantastic customer support
Download, edit, and present!


