
Do you remember every single piece of information about some topics that you were taught by your teacher during geography lectures? And if you do, what’s the reason that after so many years of completing education, some geography lessons are still inked in your mind? Perhaps your teacher had used some relevant teaching aids (such as globe, maps, etc.) to supplement verbal instructions. Well, visual aids are helpful not only in education but also in business presentations.
Undoubtedly, a well-crafted speech is important to ace a presentation; visual aids are equally crucial to enhance the effectiveness of your message and make it easier to understand and memorable for the audience. Visual aids assist in quick information processing and retention by triggering the brain even if it is feeling fatigued.
Let’s discuss some visual aids that can help add more clarity, comprehension, and meaning to your presentations.
1. Chart and Graph
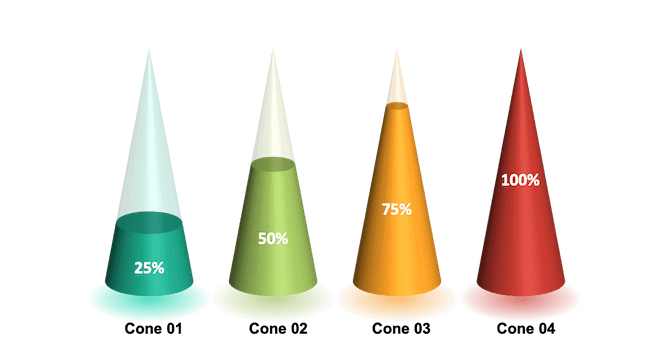
Chart and graph are the perfect visual aid to illustrate the relationships between variables, trends over time, comparisons, patterns between data points, the proportion of the whole part, etc. Using these visuals, you can represent data variables in the form of categories, percentages, and frequencies.
Expert Tips:
- Don’t use flashy special effects; keep it simple.
- Give the right title to your chart or graph to convey your message clearly.
- Choose contrasting colors to highlight two data sets.
- Avoid using 3D graphs as they are hard to read.
- If you use different colors or shades to depict the different data sets or variables, make sure you provide an index to explain them.
2. Diagrams

Diagrams are sketches or drawings that can be used in presentations to represent certain things that can’t be demonstrated through images and photographs. When you showcase data using tables, some facts are not revealed. Diagrams help bring out these facts and relations. Diagrams can also be used to explain the structure, functioning, and working processes.
Expert Tips:
There are different types of diagrams, such as flowchart, Venn diagram, mind map, funnel chart, journey map, etc.; it is important to choose the right one that can better resonate with your information. It is recommended to use a more professional version of the diagram designed with computer software.
3. Icons
As icons are self-explanatory visual elements, they make interaction faster and impactful without making the audience feel overloaded with text. Icons have a high symbolic value, and they enhance the aesthetics of the presentation, rendering it a unique visual appeal. Since icons have universal meaning, they are easily understandable regardless of language barriers.
Expert Tips:
- Icons should be scalable for different screen sizes.
- Don’t overload icons with non-essential graphic elements.
- The icons should be relevant to the context you are going to represent and must match the tone and style of the brand.
4. Maps

Maps depict a 2D model of the real world and are the best pick to portray sales territories, locations, business outlets, history, demographics, and geographical details of any specific region. You can also incorporate maps in your slides to represent the shortest route, connectivity of infrastructure across different regions, climatic conditions of different cities of a country, and much more.
Expert Tips:
- Use vector-based, editable maps in your presentations so that you can adapt them to your corporate design.
- Use a color legend to illustrate data by country and region.
- Combine maps with bar or pie charts to provide a clear overview of any discrepancies between regions.
- Supplement maps with icons to make information more meaningful.
5. Video
You can take your presentations to the next level by incorporating videos in smarter ways. A well-thought-out video adds persuasion and personalization to the content, enlivens your slideshows, and captures the sensory memory of the audience. Moreover, videos break the monotony and allow the audience to relay the information and reconcentrate with full attentiveness. These visual aids also provide an emotional input to influence the actions, choices, and decisions of the viewers.
Expert Tips:
- Don’t use video just for the sake of adding drama to your slideshows.
- Avoid including video clips that are too long for the overall length of the presentation.
- Use videos that complement your core message.
- Don’t include complicated videos; a simple video with short animation can serve your purpose well.
6. Handout
You can’t brim your slides with too much content as it will ruin the effectiveness of the entire presentation. If you want to provide a detailed overview of the central insights, core concepts, and main points, you can distribute the handout at the commencement or end of the presentation. Handouts support and enhance your presentation and act as a memory aid and guide for the audience.
Expert Tips:
- The handout is the concrete manifestation of your presentation, so it should follow the same structure as your slides. However, it should have additional information, not the exact printout of slides.
- The handout must have a consistent feel and a professional look.
- If you are using information from other sources, then include references in the handout to let the audience know where they can find more information about a particular point.
- Provide contact details so that the audience can contact you at some time in the future.
7. Tables
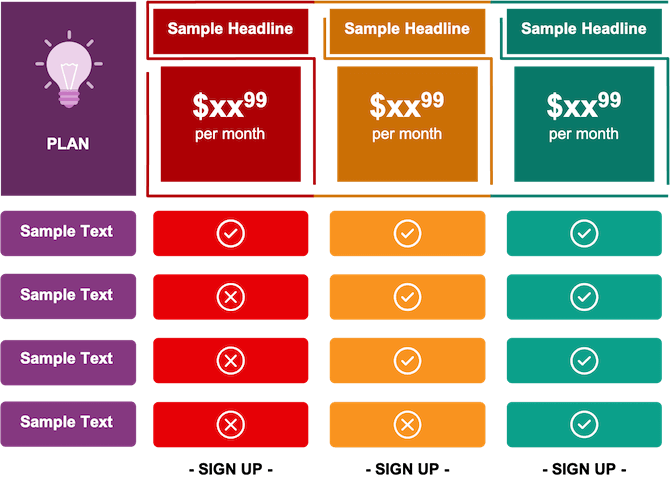
You can facelift your PowerPoint presentations and give them a more structured look by organizing quantitative data into rows and columns using a table. You can leverage this visual aid to represent data related to accounting audits, quarterly reviews, KPI comparisons, price lists, etc., and provide efficient and fast readability. In addition, tables ease the cognitive burdens of viewers and reduce the time required to extract the information.
Expert Tips:
- To make tables more creative, you can animate them, add icons, and beautify them with stunning colors.
- To lay emphasis on any particular data series in the table, animate them one-by-one instead of all at one time.
8. Pictures and Images
If you are planning to talk about an unfamiliar but important topic in your brainstorming session, team meeting, or conference, you can make use of images or pictures to break incomprehensible information into digestible bits and add more clarity to your message. Further, you can add a personal touch to your presentations by including these aids.
These visual aids also help break the ice and get the undivided attention of the audience. The best part about pictures and images is; they quickly drive audience engagement and make an impactful connection with them irrespective of language barriers.
Expert Tips:
- Use original images/pictures to increase the authenticity of your presentation.
- Images used for the sake of filling empty spaces on slides may distract your audience. So, use images that are relevant to the context, amplify your message, and reflect your brand personality.
- To avoid blurriness, incorporate high-definition images.
9. Flipchart and Whiteboard

If you want to add some informality to your speaking session, making it more interactive at the same time, you can use a flipchart or whiteboard. Since these visual aids don’t require tech knowledge to use them, anyone can easily utilize them.
These aids are also very useful if your presentation involves brainstorming any specific point/idea with the audience. The flow of ideas occurs naturally when a group of people works together to create them. In such a case, you can jot them down quickly on the flipchart or whiteboard.
Expert Tips:
- Write in larger fonts so that people sitting in the back can easily read the words you have written.
- Use more saturated and darker pen colors to make information clearly readable.
- Instead of writing in front, stand to the side of the board so that everyone can see the board while you are writing.
- Write short sentences.
- Don’t write anything before the commencement of your speech; otherwise, the audience will get engaged in reading the content written on the board without paying attention to what you are saying.
10. Models and Props
Models and props are physical objects that you can hold in your hands while explaining a specific topic verbally. Nearly anything can be a prop: a water bottle, a globe, a model car, etc. These visual aids provide a multi-sensory experience and act as memorable and powerful metaphors.
Expert Tips:
- Props and models must be relevant to the speech or presentation.
- You can use these visual aids if the original object is too large to bring in and if you want to add more comprehension and clarity to your message/information.
- Never leverage these aids as a way of avoiding interaction or eye contact with the audience.
Conclusion
Visual aids, also known as sensory aids, help you shun rambling and stay on the topic and organize your speaking points. They also act as a savior if you get hit with a bout of fright on the stage. Indeed, presentation aids, if used thoughtfully, render clarity to your message, stimulate an emotional response in the audience, and empower the overall presentation; however, they are not a substitute for a poorly-crafted and unprepared speech. So, select visual aids astutely and use them only if you really need to explain a complex concept or fulfill a specific purpose related to the presentation, not just for the sake of using them. In a nutshell, the presentation aid must have high relevance to your content, and it must strongly support your talk.
Do you have more insights to share with us? Feel free to write to us in the “Comment” section. And if you find the blog post informative, do share it on your social media handles.


