
Radial charts can really come in handy if you want to simplify a large, complex dataset and summarize it in a visual form. They will help your viewers see a data comparison at a glance to understand information instantly or make an immediate analysis.
Whether it is a business plan or a project proposal, radial charts can perfectly illustrate proportions. If creating a perfect radial chart in Google Slides seems like a challenge, this tutorial would be a great help to you. So, let’s begin!
Step 1 – Open Google Slides. Ensure you already have a Google account to use any Google tool.
Step 2 – Then, open a presentation of your choice and select the slide you want to add your chart to.
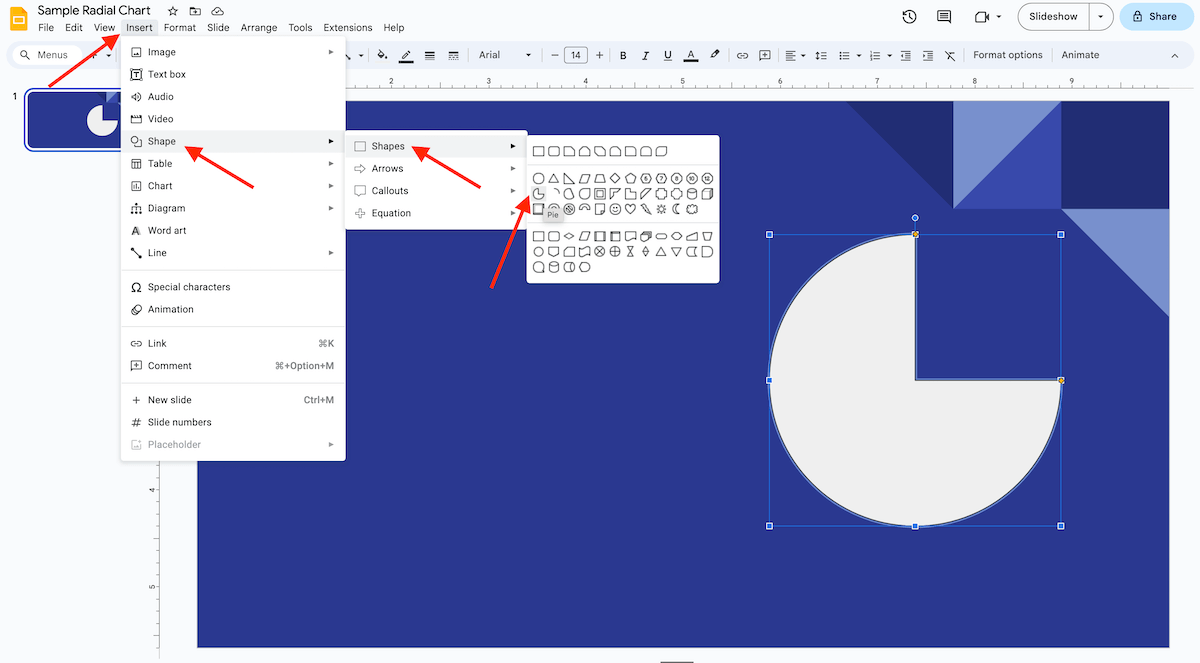
Step 3 – Now, it is time to add the Pie shape. For that, click Insert >Shape >Shapes >Pie. After this, the other attributes, such as Fill Color, Border Color, Border Weight, and Border Dash, can be picked to design your pie chart further. You can even use your brand colors.
Note: Do not add a Chart but a Shape.
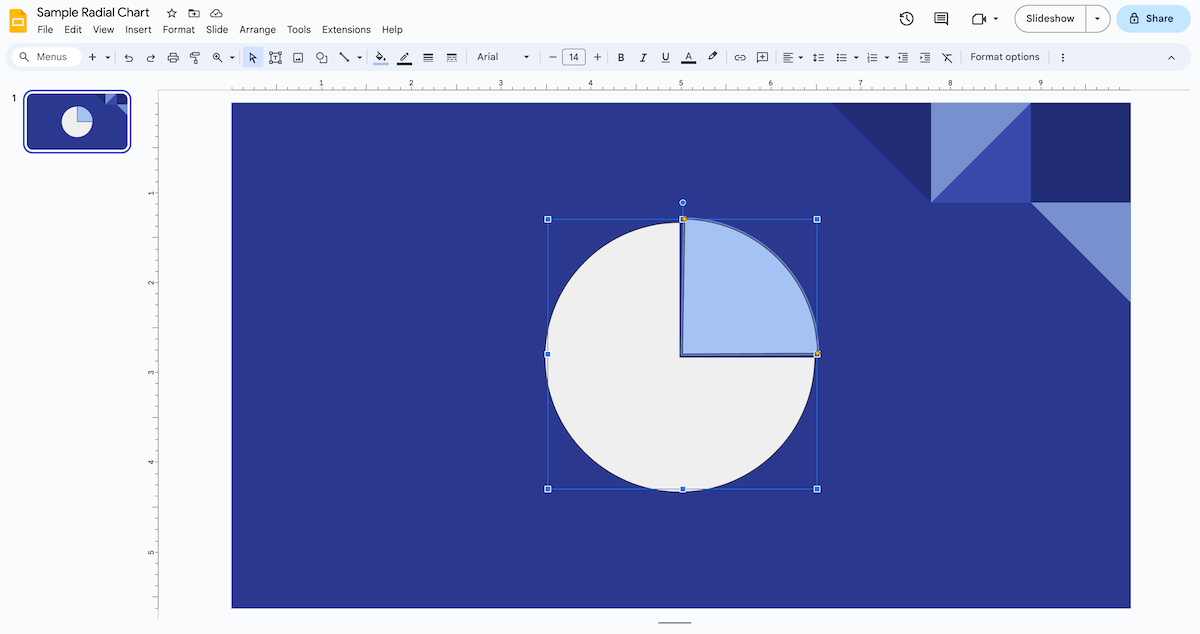
Step 4 – The next step is to duplicate the Pie shape and create a second outer body. For that, just Copy (Ctrl + C) and Paste (Ctrl + V) and start modifying it. In order for the radial chart to work, you need to leave space between the two outer bodies. Also, the shapes should have some symmetry, or else you’d lose the visual effect.
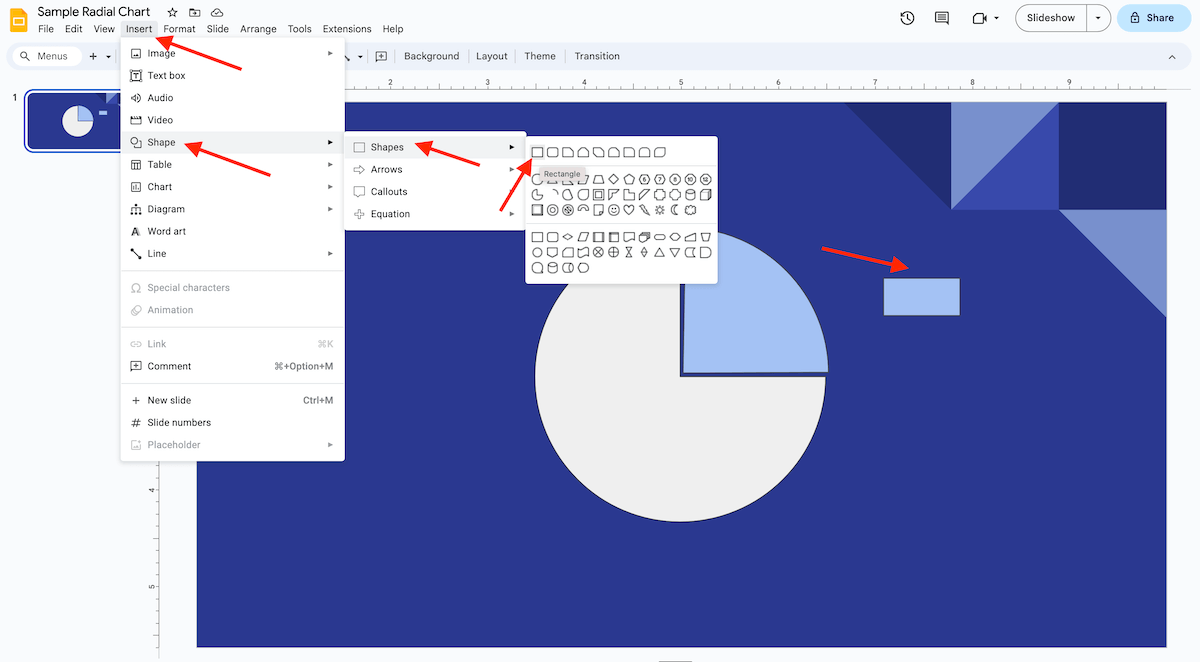
Step 5 – One of the key features of radial charts is that they visualize data. Hence, providing numerical values for your viewers to connect the dots, becomes a necessity. For this, click Insert >Shape >Shapes and select a shape from the first row, let’s say a Rectangle (the first figure).
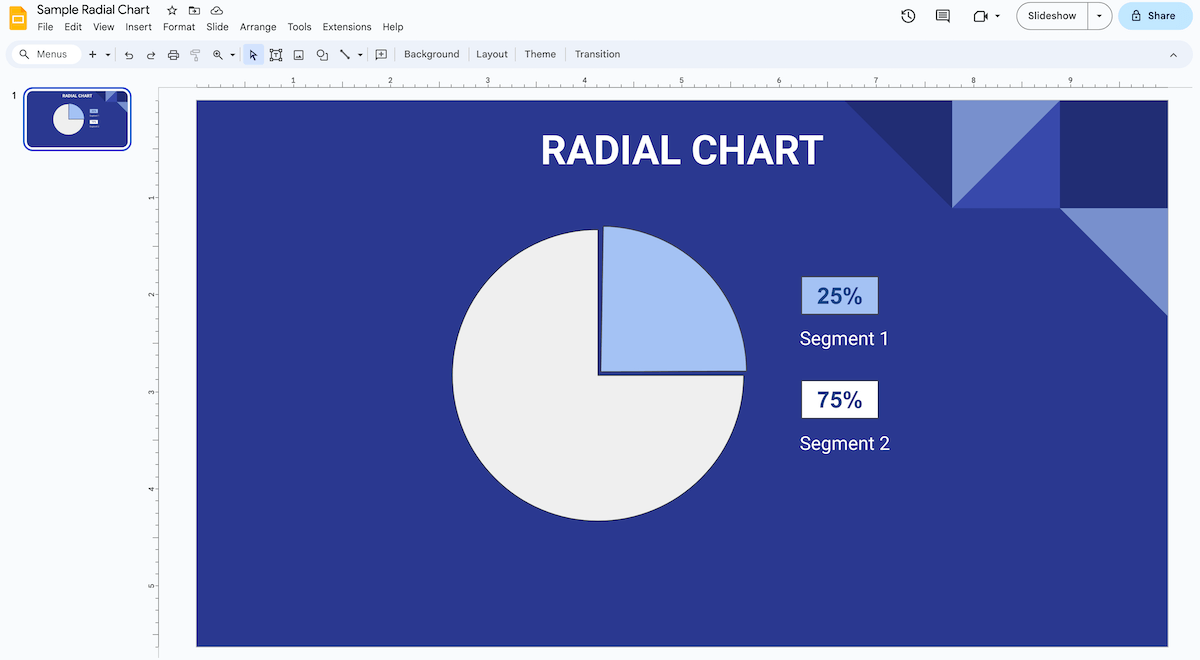
Step 6 – Now, finish the figure by adding data, formatting the shapes, and editing the font size, color, etc. Also, you can add a title and descriptive text if you want.


