Barometer Icons for PowerPoint and Google Slides
(15 Editable Slides)
Barometer Icons for PowerPoint and Google Slides
Available For
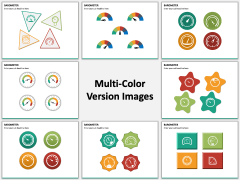
Do you have an important meeting coming up and you don’t want to leave any stone unturned? Well, if you truly wish to impress your audience, then look for new and interesting ways to present your data. Most of the applications have limited graphics, and it can be a bit redundant to use them multiple times. Therefore, it is recommended to use dedicated illustrations to have a unique appeal in your slideshows. For instance, you can take the assistance of these editable PowerPoint Barometer Icons and present all kinds of information to your audience in a simpler yet interesting manner.
Designed for All
As you can see, these icons have a universal appeal, which makes them fit for all kinds of industries. From managers to executives and marketers to educators – everyone can make the most of these icons the way they like. Your audience would surely understand the context of these graphics, and you can further customize them as per your needs. As a result, you can give your data an aesthetically pleasing look while still presenting the details to your audience. Not only would it help you present something in an interesting way, but your audience will also retain the shared information for a longer period.
So Many Icons to Pick From!
We want you to use this Barometer Icons PPT template on different occasions to fit your professional needs. Therefore, our designers have come up with a wide range of icons here based on different themes. Once you have downloaded the set, you can use these icons on multiple occasions without any copyright issues. In this way, you would never fall short of the essential visual aids to give your everyday presentations a professional look.
For a Stunning Visual Look
At the end of the day, it is all about how you present your data to your audience. If you would include too much textual content, then you might lose the interest of your audience. To avoid this, you can include more visually appealing graphics like these icons in your slides. You can use them to measure the output of a certain task, present customer feedback, show the progress of the project, and do so much more.

