India Maps
Editable India Maps for PowerPoint and Google Slides
Download our fully editable India Maps templates for PowerPoint and Google Slides comprising beautiful and innovatively designed maps of India, a country in South Asia. These maps offer great versatility and flexibility, enabling the users to customize them as required and incorporating them in their presentations. Since our in-house design team has designed these decks after in-depth research, there will be absolutely no copyright infringement issues.
Read More
- Sale

-
- Sale
- Sale
- Sale
- Sale
- Sale
- Sale
- Sale


Take a Look at the Usages
From C-suite executives to business analysts, geographers to researchers, these clear and precise maps can be used by professionals from different industry verticals for illustrating a plethora of information such as:
- Business environment in different states
- Challenges and opportunities for growth
- History and economy of the region
- Weather conditions, demographics, and socio-economic statistics
- Major landforms, localities, subdivisions, and cities
- Market overview and competition
- Targeted consumer markets
- Possibilities to set up sales points
- Popular tourist spots and best time to visit
- Business units, branches, and headquarters
The maps feature various states (such as Maharashtra, Gujarat, West Bengal, Uttar Pradesh, etc.) and well-known union territories and cities (such as Mumbai, New Delhi, Kolkata, etc.) of India, which can be used for educational purposes as well.
Feature-Rich Maps
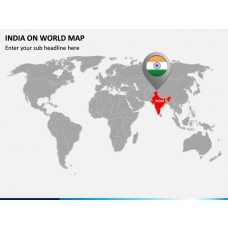
- You can use the different flags, GPS markers, map pins, and vectors to make your presentations more engaging and informative. For instance, if you want to specifically highlight any location, you can change its color and place a map pin to highlight it.
- The statisticians can use India’s political map to demonstrate critical economic and business statistics.
- The man holding the flag of India can be used to depict your business presence there.
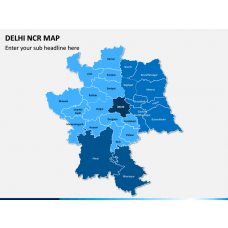
- You can use the maps with zoomed pictures of some of the major cities/regions to demonstrate the demographics and other aspects of those areas in detail.
- The text placeholders enable you to insert your text in the desired format to supplement your visual data.
- Our maps are entirely editable and can be easily used in presentations for demonstration in any webinars or other live videos to your online audience.
- These high-quality maps maintain the exact resolution and quality on different screen sizes.
So, don’t delay and download these PPTs right away!

Diagram Finder