Compare Diagrams
Comparison Slide Templates for PowerPoint and Google Slides
Representing comparison between two or more data sets, phenomena, products, business models, and other concepts on different parameters in a captivating manner is now easy with our Comparison slide Templates for PowerPoint and Google Slides. The stunning designs make your content more powerful and memorable, enabling you to convey it in a comprehensible way. Further, using these creative PowerPoint slides, you can communicate more in less time, making the overall presentation interesting and intriguing for the audience. So, take quick action and download the decks with immediate effect!


Usages
Professionals from different industries and domains, such as business analysts, researchers, investors, product and project managers, etc., can make the most of these PPTs by showcasing the following information:
- comparison of data in percentage
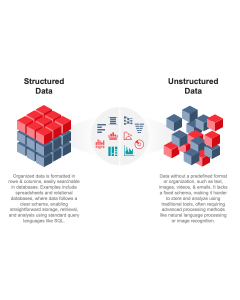
- contrast and compare different data sets and statistics
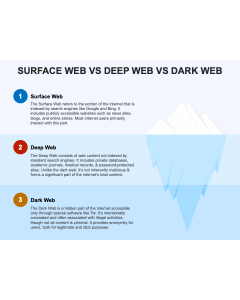
- relationship between items
- positive and negative correlation between two or more variables
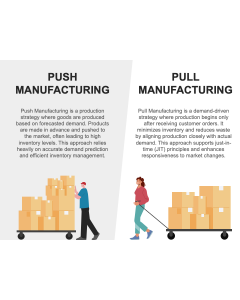
- comparison of different products or features of the same product
- comparison of investment plans
- comparison of pricing plans, and much more
Text insertion in the provided text placeholders is extremely easy. You can put the content in any font and color that best matches your preferences and presentation theme.
Spellbinding Features
- All the slides are 100% customizable. You won’t need technical prowess to make alterations in any aspect (size and color).
- Download once and get complete ownership to use them at any point of time in the future.
- Diligent customer care desk to provide resolution to your queries at the earliest.
Visualize your ideas in a meaningful way; download the Comparison PPTs now!