
Process Donut Chart for PowerPoint and Google Slides
(10 Editable Slides)


Process Donut Chart for PowerPoint and Google Slides

SB872
Available For


Tags:
Similar Products
- Sale

- Sale
- Sale


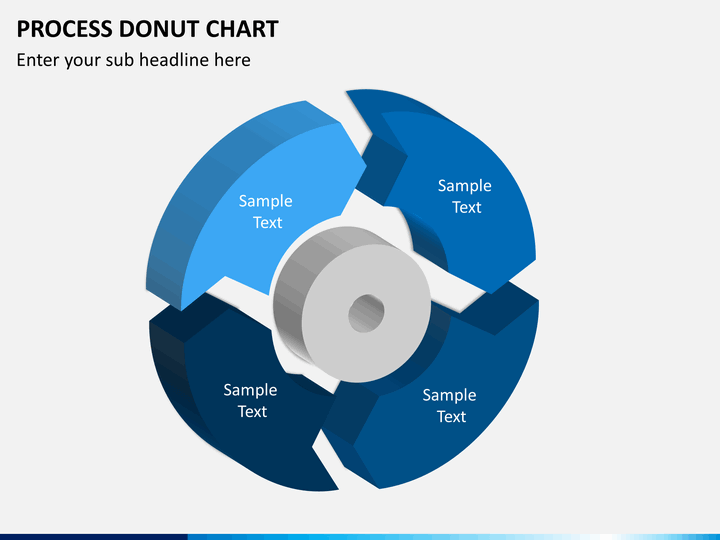
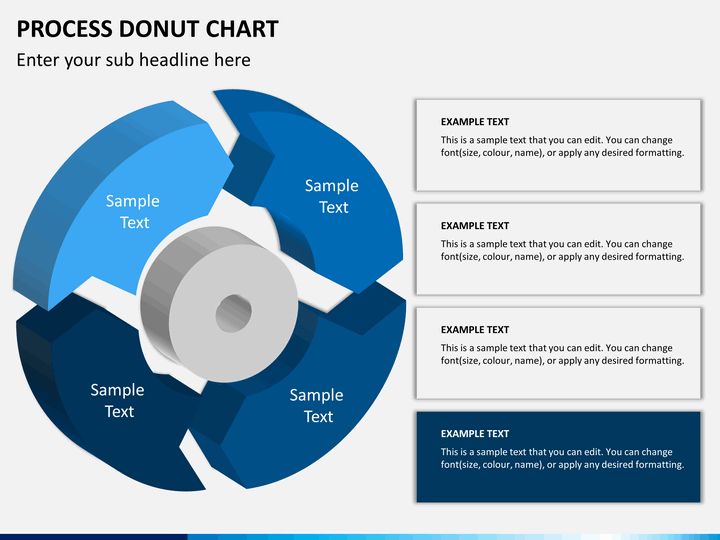
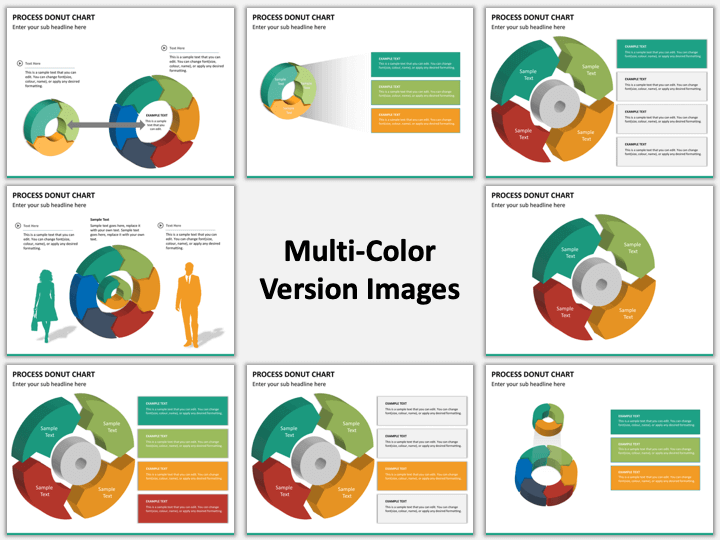
Grab your hands on our Process Donut Chart PPT template to visualize your data/information in an eye-pleasing manner, take your boring presentations a level up, and keep your intended audience glued till the last slide. The set is fully editable and features well-thought-out illustrations. Sales professionals can leverage it to describe the sales proportions from different units and locations. Marketers can illustrate the percentage of traffic driven by marketing and advertising mediums. Consumer behavior experts can highlight the impact of different factors like consumers’ taste and preferences, market trends, competitors, and more on buying decisions.
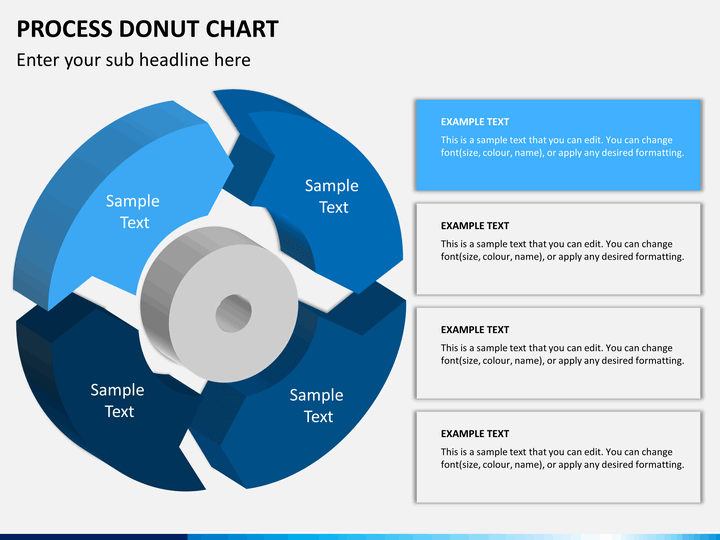
Eye-pleasing Visuals
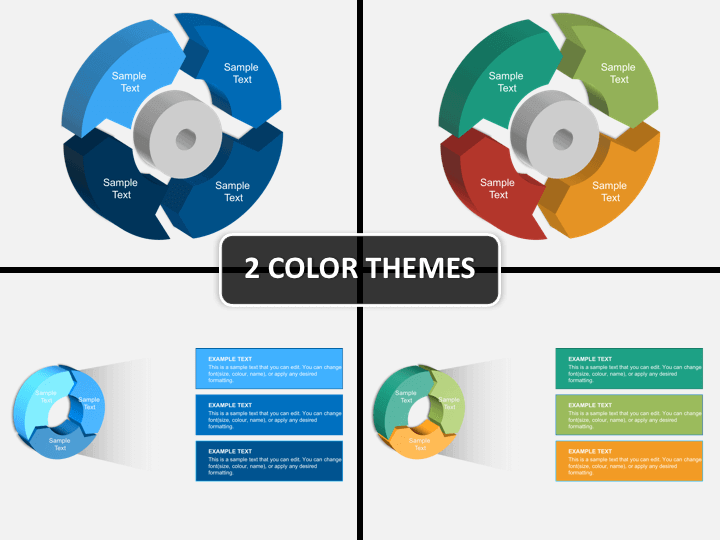
The PowerPoint slides have a variety of colorful donut chart infographics, which are similar to pie chart diagrams. You can use them to describe the ratio of men, women, adults, children, and others in the total population, literacy rate in different regions of a city, state, or country, and much more.
Quality Features
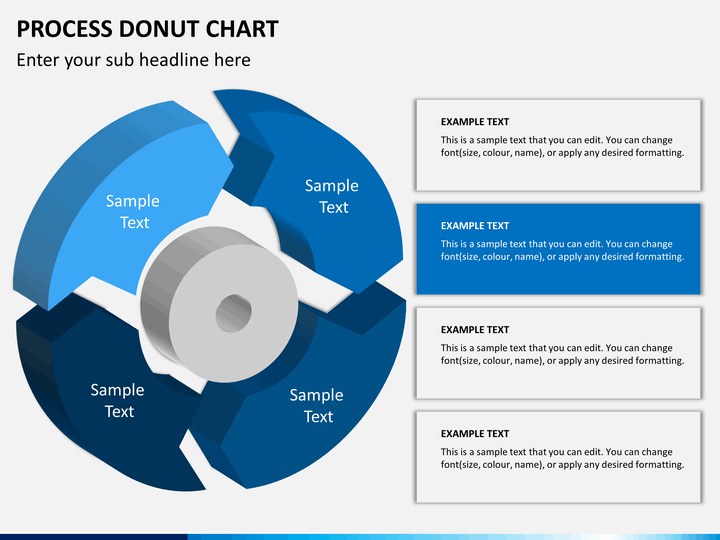
- The icons, illustrations, and other deck elements can be edited quickly.
- Get lifetime access to the PPT after downloading it once.
- The visuals offer high resolution on all screens.
Download, customize, and present!
Write Your Own Review

Related Products


