


Similar Products


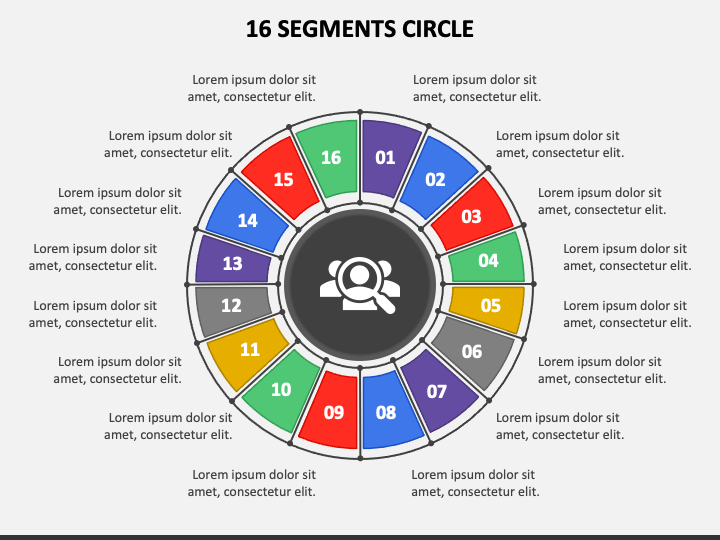
Our 16 Segments Circle presentation graphic for PowerPoint and Google Slides is a visually engaging and dynamic resource to present your textual information. The slide comprises a circular diagram segregated into sixteen segments, each colored uniquely. Editable text placeholders are provided in the slide to let you customize it your way.
Business professionals can use this illustration to display their company’s product or service portfolio, project phases, stages of a product’s life cycle, cyclic processes, etc. Senior executives can use the infographic to display budget allocation across various expense categories. Sales professionals can use the graphic to illustrate the sales performance of different products.
Features
- The graphic can be customized according to your requirements with the minimum time or effort.
- You can project the visual on any screen dimension without disturbing the optical resolution.
- The illustration has been meticulously designed to eliminate the room for copyright issues.
Download this PPT to make your presentations captivating!
Write Your Own Review

Related Products


