


Similar Products

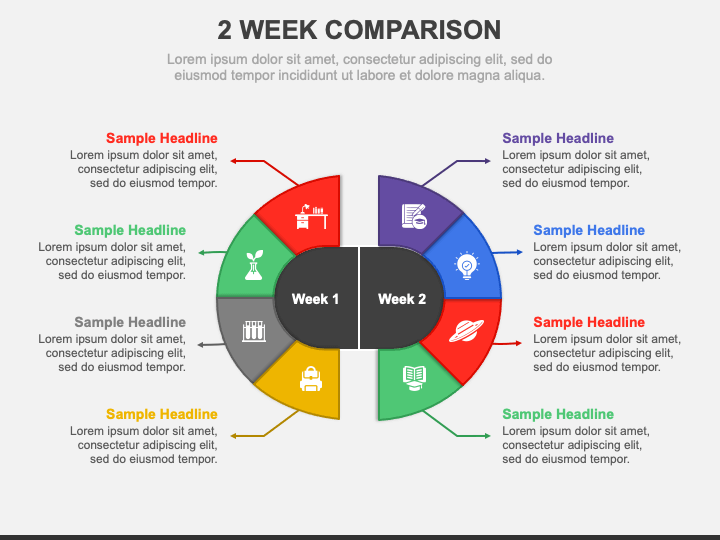
We have introduced the 2 Week Comparison slide for PowerPoint and Google Slides to help you illustrate your complex information in easily digestible points. The slide comprises an infographic of two semi-circles adorned with captivating icons and bold colors. The editable textual boxes are provided to help you put the desired content.
Sales and marketing professionals can use this illustration to highlight weekly comparisons of sales figures, leads generated, conversion rates, etc. Digital marketing teams can use this versatile layout to showcase the comparative overview of website traffic, bounce rates, user engagement metrics, follower growth, and more. Project managers can also depict the comparison of the week-to-week performance of a specific project. Additionally, you can display the weekly comparison of customer feedback and ratings, revenue and expenses, and more.
Features
- Easy-to-edit
- Assured high-resolution graphic
- Copyright-safe
- Reusable for a lifetime
- 24/7 customer support
Download this PPT to equip your presentations with creativity and professionalism!
Write Your Own Review

Related Products


