


Similar Products
- Sale

-
-
-
-
-


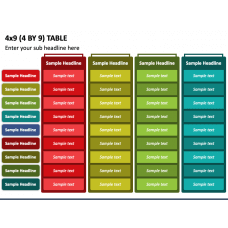
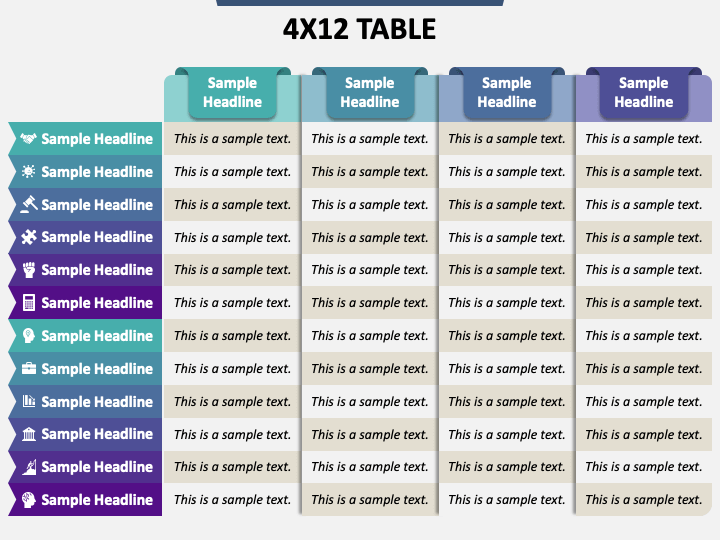
Get your hands on our 4x12 Table presentation graphic for PowerPoint and Google Slides to give your textual information a structured look and enhance its visual appeal. The slide features a tabular infographic of four columns and twelve rows.
Sales professionals can utilize this versatile graphic to present monthly or quarterly sales or revenue figures for a year. Project managers can also use the infographic to showcase a project’s timeline with four major milestones or phases. In addition, you can depict survey results, project resource allocation, pricing plans, comparisons, and more.
Features
- You don’t need specialized skills or external support to modify this graphic.
- The resolution and clarity of the illustration will remain uninterrupted on all screen sizes.
- No user will encounter copyright issues, as the visual has been designed from scratch.
Utilize this versatile diagram featured in this PPT to give your slideshows a polished and professional look!
Write Your Own Review

Related Products


