


Similar Products
-

-
-
- Sale
-
-
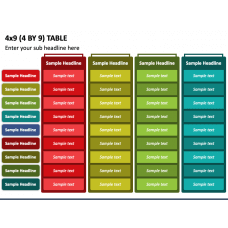
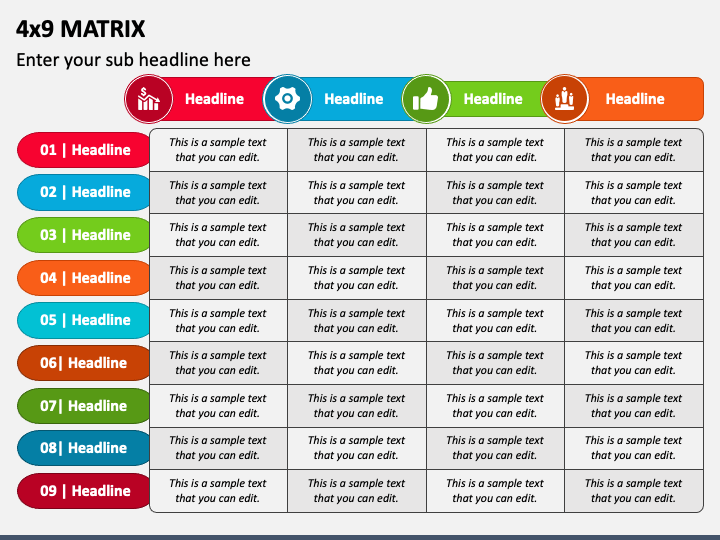
Download our 4x9 Matrix presentation graphic for PowerPoint and Google Slides to showcase a wide range of topics in a crystal clear and easy-to-comprehend manner. The slide features a tabular infographic of four columns and nine rows with editable cells to put the desired information.
Sales and marketing professionals can leverage this illustration to depict a comparative analysis of products and services of different companies based on various attributes like cost, features, and other criteria. Market and business analysts can also use this infographic to visualize customer segmentation based on demographic or psychographic variables like age, income, location, interests, etc. Additionally, the graphic is the perfect resource to represent the project status, performance metrics, and more.
Distinctive Features
- You can rest assured that the graphic won't lose its quality, even when projected on a bigger screen.
- Once you download this PPT, you can use it indefinitely.
- Customizing the illustration to your liking is effortless.
- The entire graphic is designed after thorough research to keep copyright issues at bay.
Add interest to your presentations by using the infographic embellished in this PPT; download it now!
Write Your Own Review

Related Products


