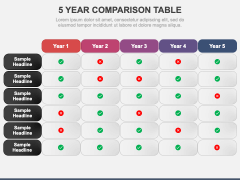
Use our 5 Year Comparison Table graphic for PowerPoint and Google Slides to integrate simplicity and professionalism into your presentations and increase audience engagement. The slide features a tabular infographic of five columns and five rows with right and wrong tick marks. Editable text placeholders are provided to insert the desired content.
With this infographic, business analysts can highlight significant achievements or setbacks during the five-year period. Sales professionals can portray the revenues, customer acquisition, and other sales-related metrics over the five years. Project managers can use this versatile graphic to demonstrate the targets achieved and missed over a specific period. Market experts can depict which marketing campaigns met and missed the set goals of website traffic, social media engagement, conversion rate, etc.
Features
- No user requires prior editing knowledge or special tools to modify the graphic.
- The original resolution or clarity won’t get disturbed, even when projected on a bigger screen.
- Our designers have crafted the illustration thoughtfully to eliminate the room for copyright issues.
Lay your hands on this PPT to make your slideshows more engaging!


