


Similar Products
-

-
- Sale
-
-
-
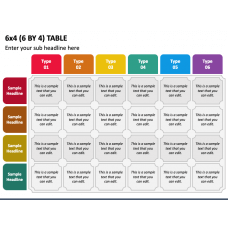
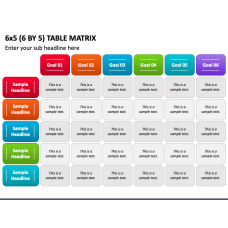
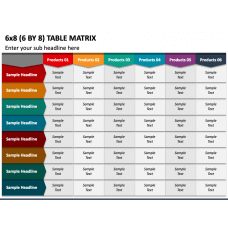
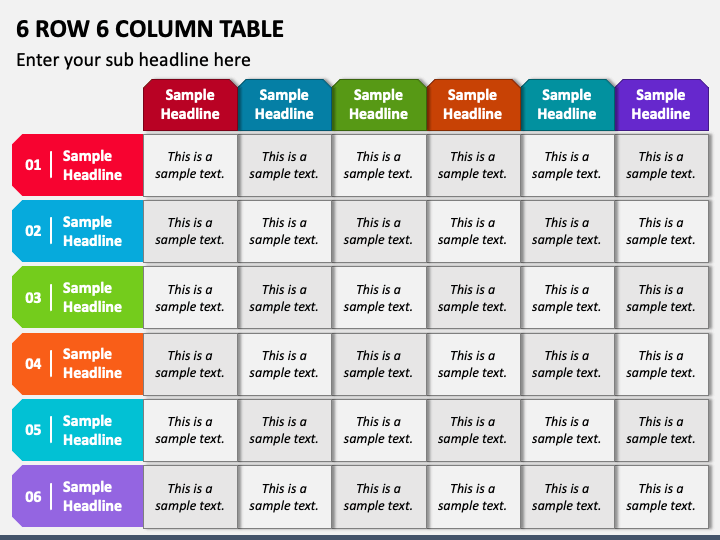
Use our 6 Row 6 Column Table presentation graphic for PowerPoint and Google Slides to break up text-heavy information, making it easy to understand. It features a tabular illustration with entirely editable cells.
This multi-use infographic comes in handy for product managers and business development executives to represent a comparison of different products, services, or ideas based on their features, prices, or performance. Financial analysts can also use this illustration to showcase trends over time in a well-summarized manner. Further, the infographic is the perfect visual aid to highlight survey results.
Distinctive Features
- The graphic can be customized to suit your needs without a fuss.
- You can scale the layout on any screen size without optical resolution loss.
- Each object is meticulously designed to keep copyright violation issues at bay.
- You can leverage this infographic an end number of times after downloading once.
Leverage this versatile tabular infographic to convey your message with clarity and impact and give your slideshows a touch of creativity; get it now!
Write Your Own Review

Related Products


