


Similar Products


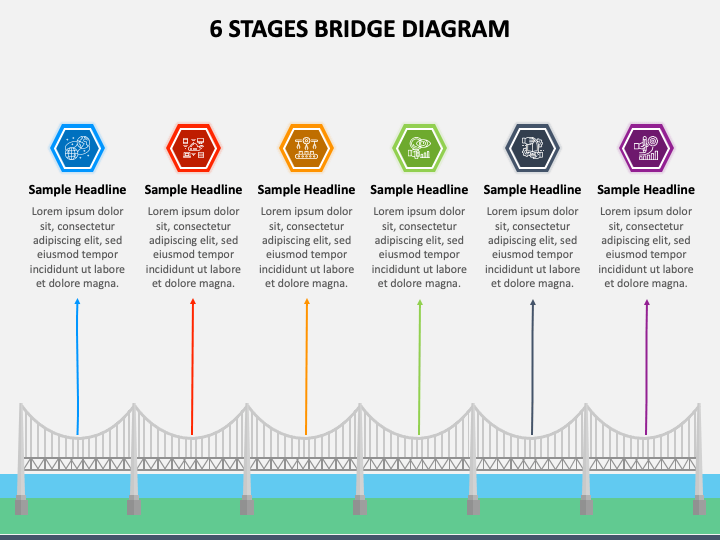
Our 6 Stages Bridge Diagram for PowerPoint and Google Slides is an ideal resource to improve the delivery of your message. The slide comprises a bridge infographic with aesthetic icons, subtle color contrasts, and editable text placeholders.
With this illustration, product managers can visualize the stages of the product development lifecycle. The visual comes in handy to highlight stages of learning, business development, career growth or advancement, etc. Business development managers can also make the most of the infographic to depict their organization’s progress, notable events, product and service offerings, corporate values, etc.
Features
- Modifying the graphic according to your preferences without special tools or prior editing knowledge.
- The high-definition illustration maintains the same quality and clarity on all screen dimensions.
- The design process undergoes thorough research to eliminate the room for copyright issues.
Download this PPT to deliver an impactful presentation and win over the audience!
Write Your Own Review

Related Products


